A Brief Description
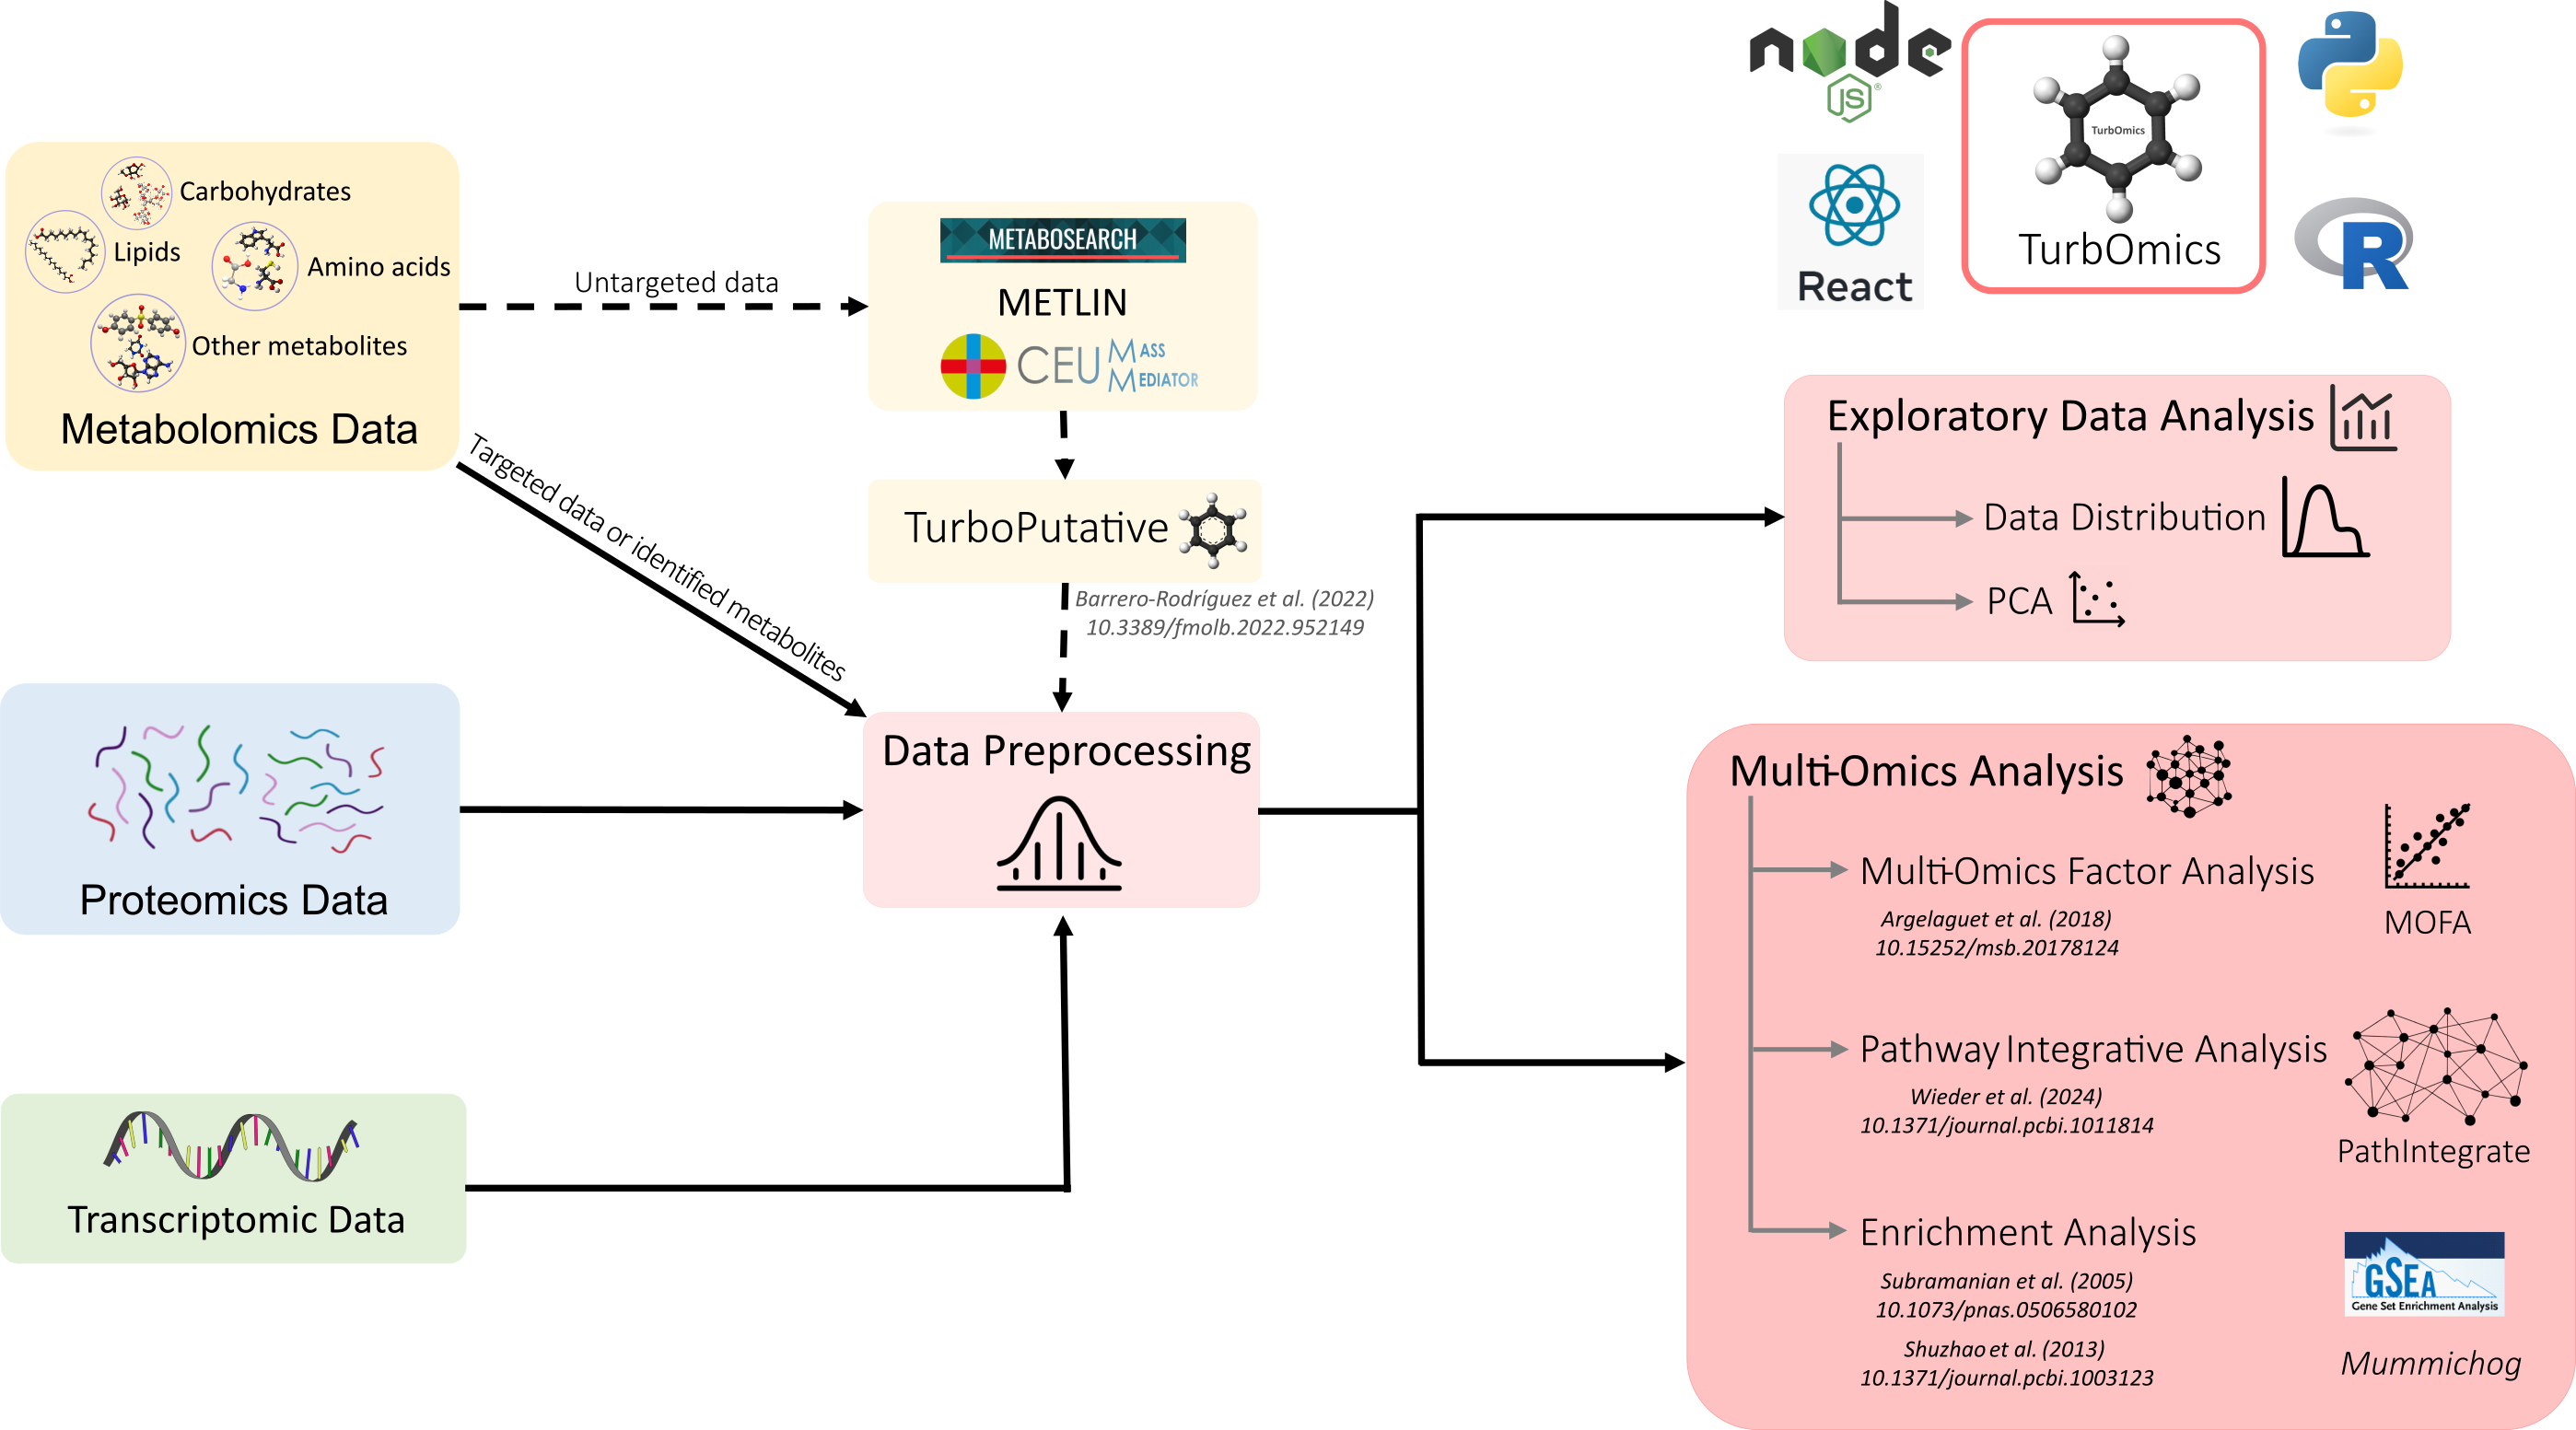
TurbOmics is an intuitive web-based platform designed to facilitate the multi-omics analysis of metabolomics data alongside proteomics and transcriptomics. It supports both targeted experiments and those where metabolite identification is available (e.g., NMR or GC-MS data). Additionally, TurbOmics offers tools to putatively annotate features from untargeted metabolomics based on their mass-to-charge (m/z) ratio.
The platform provides a streamlined workflow for exploratory data analysis and multi-omics integration, through three main modules:
- Multi-Omics Factor Analysis
- Pathway Integrative Analysis
- Enrichment Analysis
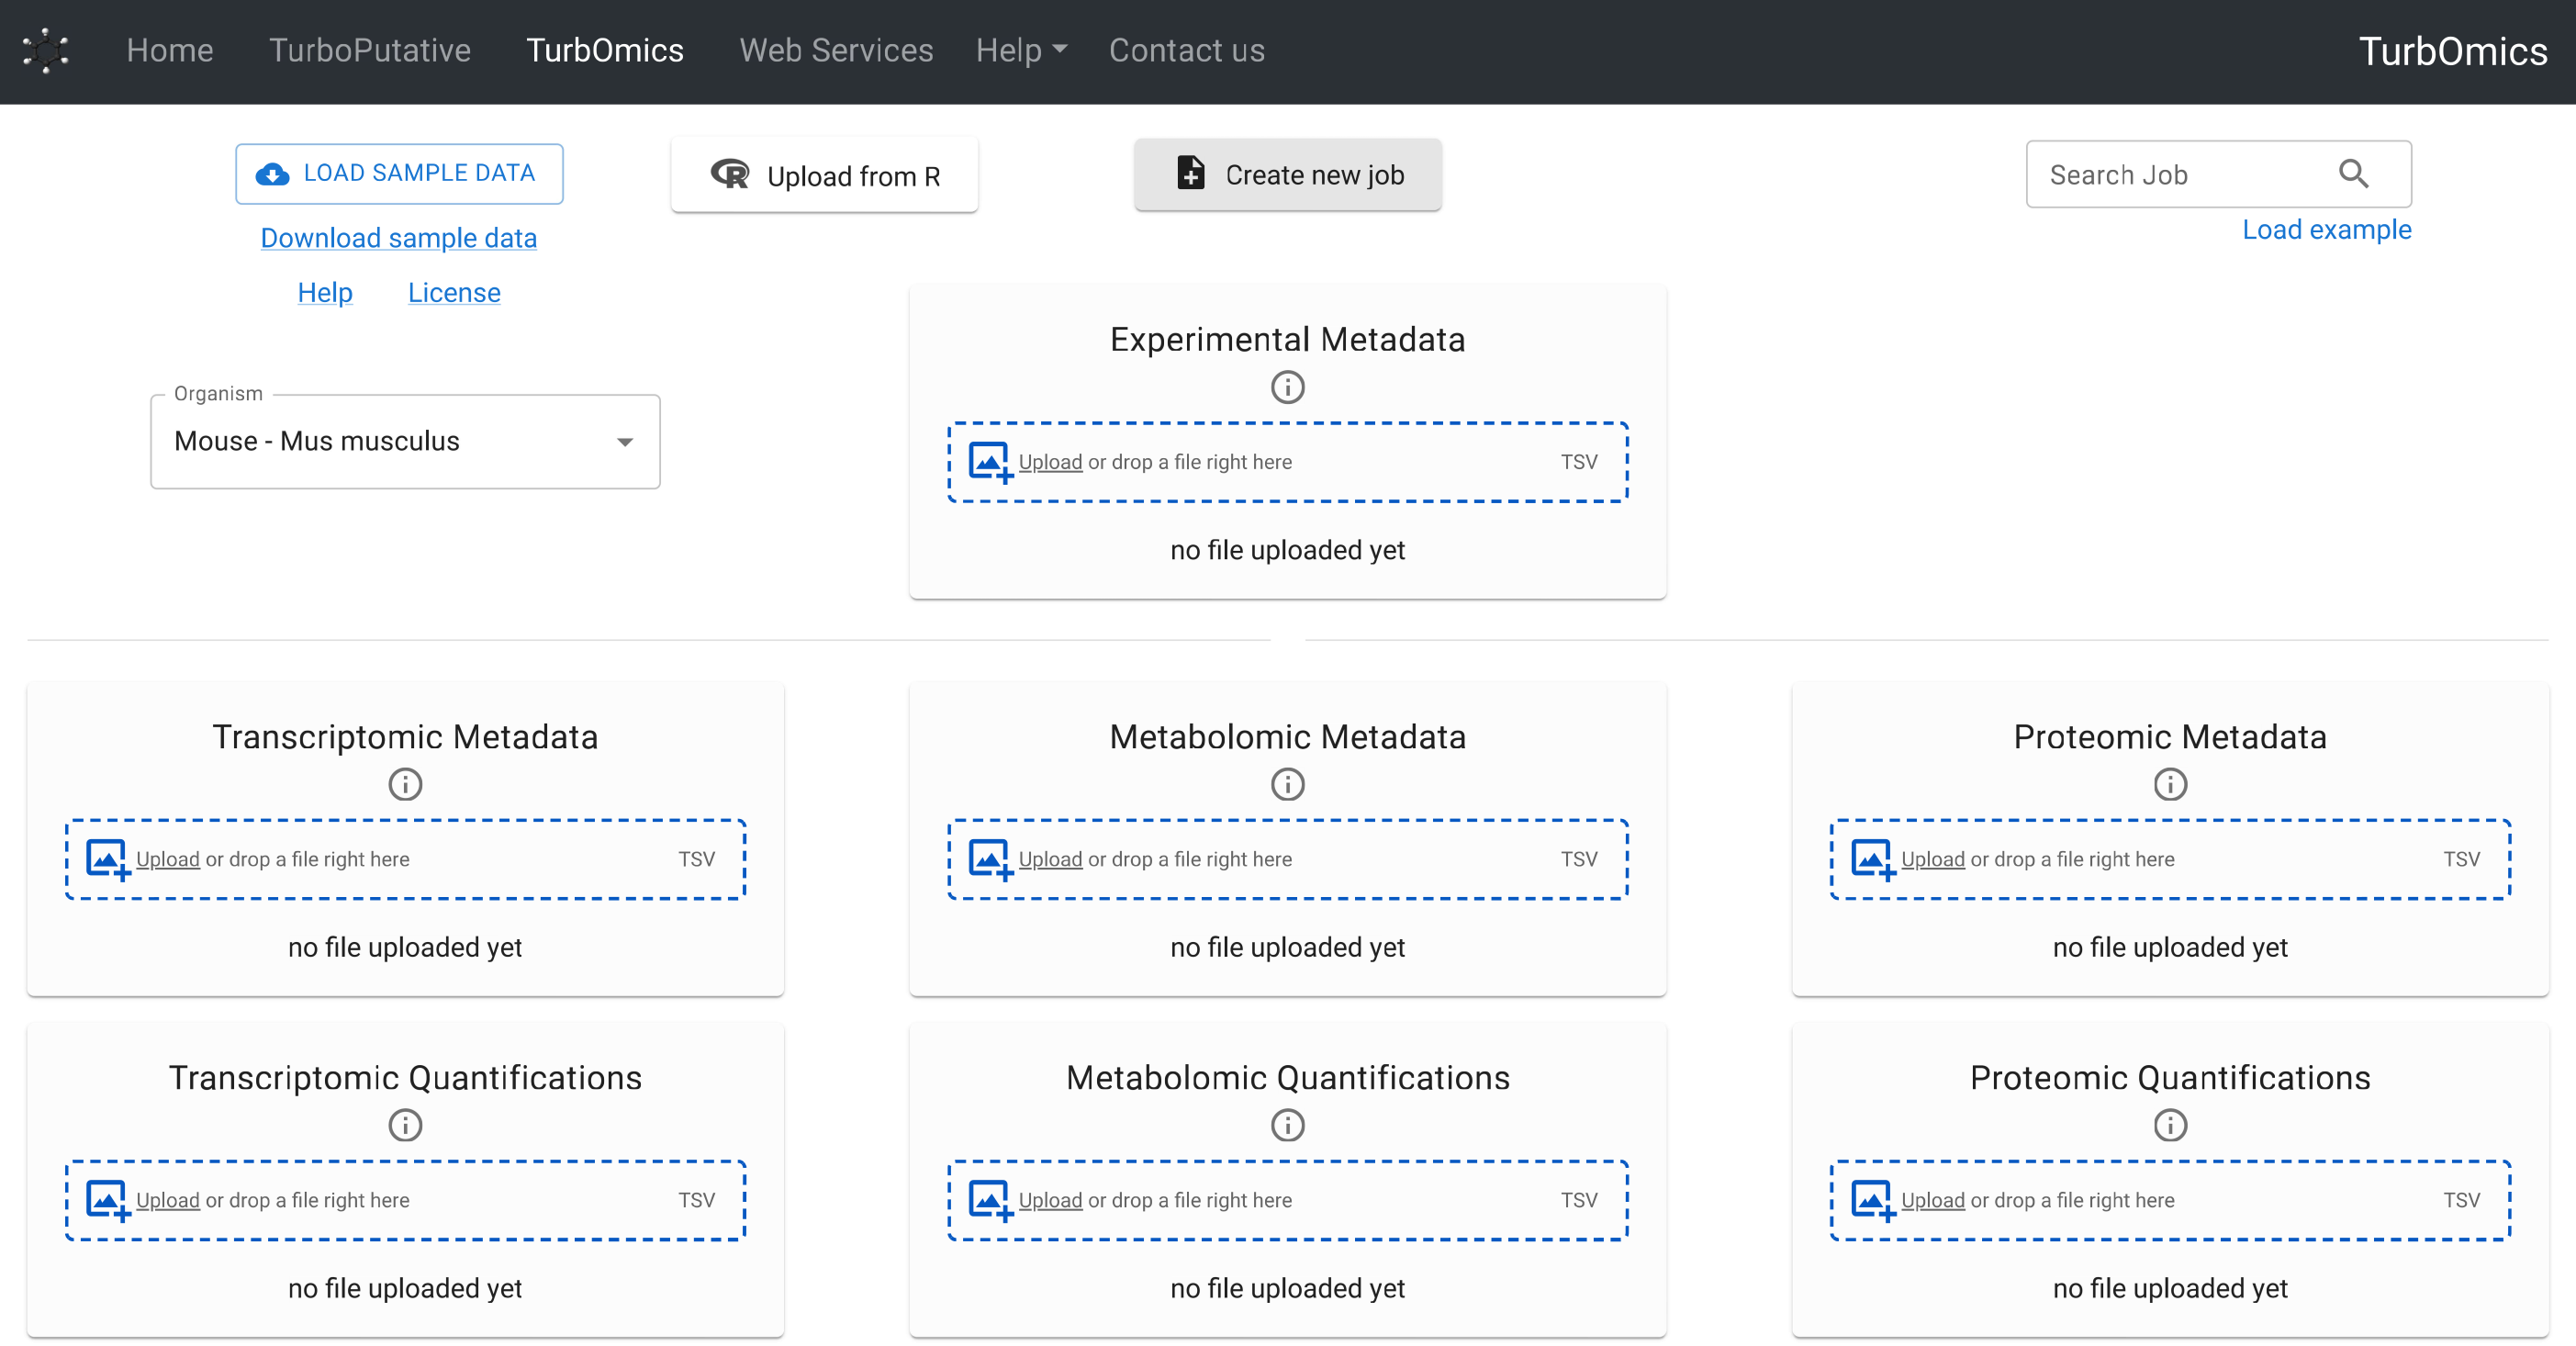
To get started, users can upload their experimental data directly from the Main Page. Previous analyses can be accessed using the Find Job field by entering the corresponding job ID. Once a dataset is loaded, the Results section provides access to a suite of tools for in-depth analysis and interpretation.
This guide describes the different functionalities of TurbOmics, from data upload to results exploration.
The platform is described in detail in the following publication, which can be referenced
when using TurbOmics:
Barrero-Rodríguez, R. et al. (2025). TurbOmics: A web-based platform for the analysis of metabolomics data using a multi-omics integrative approach. bioRxiv. https://doi.org/10.1101/2025.05.09.653072
Data Structure and Upload
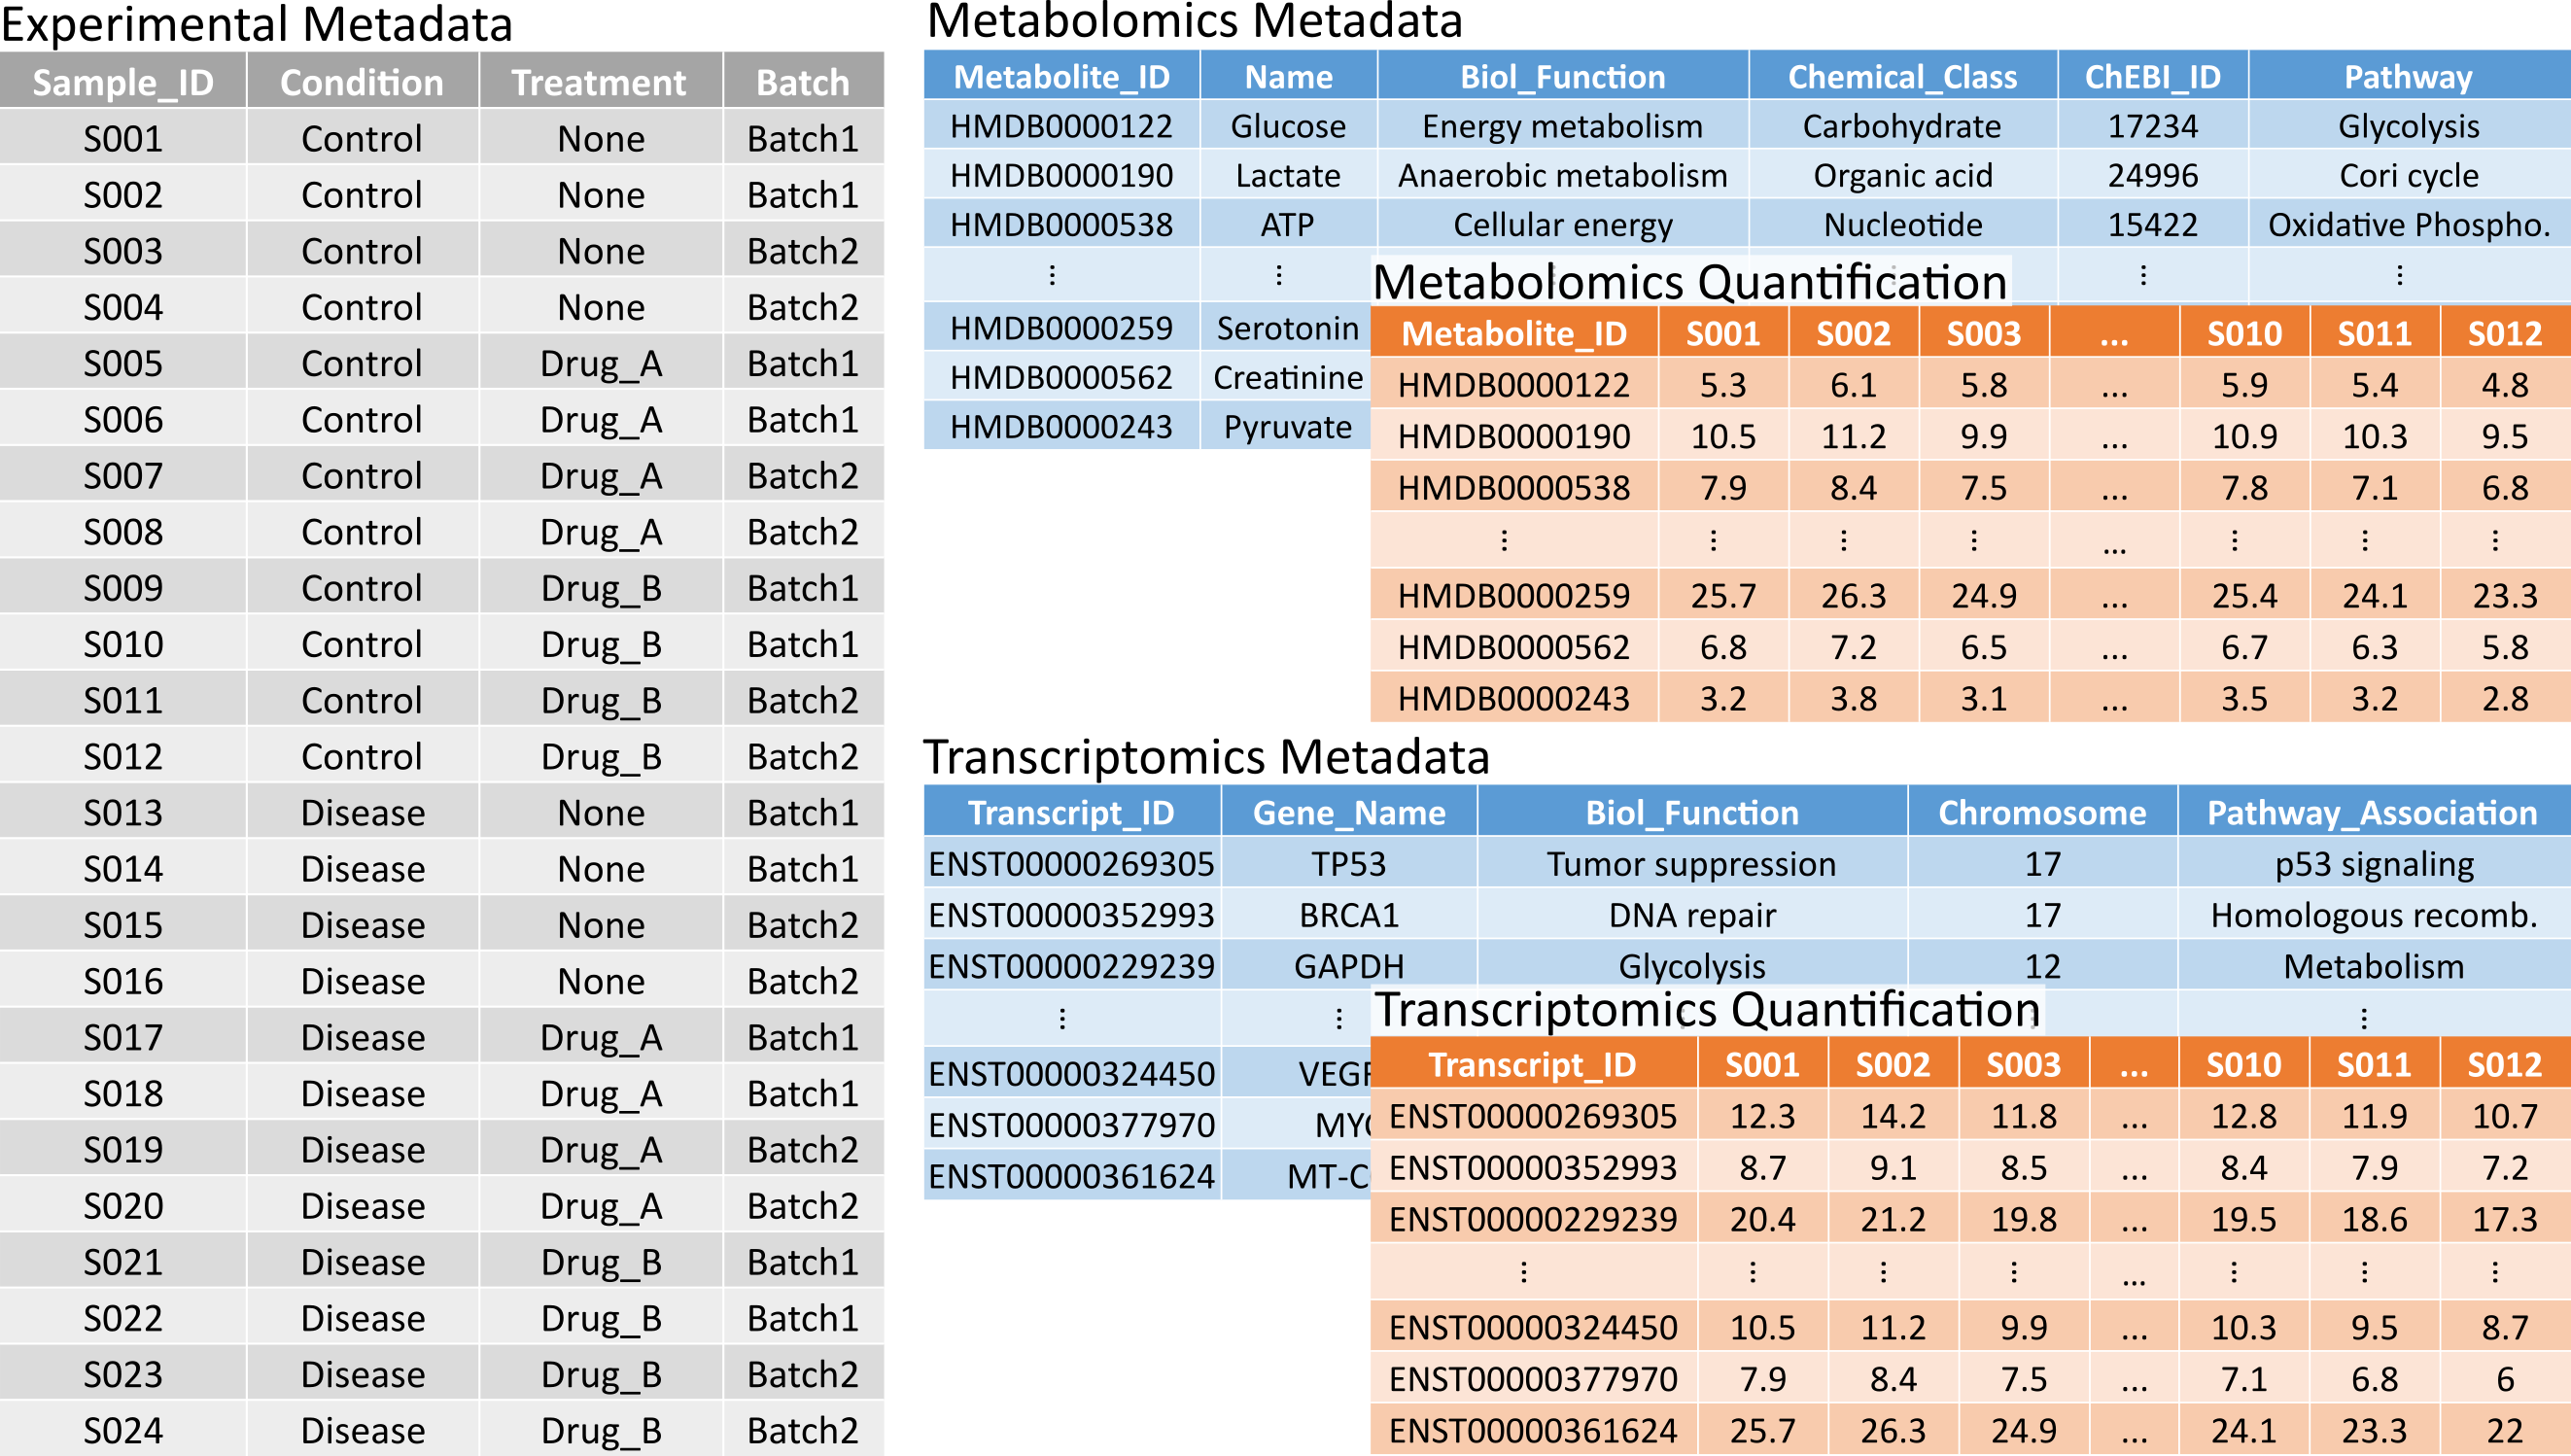
TurbOmics uses a structured data frame system composed of three types of tables: experimental metadata, omic metadata, and omic quantification. These tables must be provided in TSV format files for upload to the platform.
- Experimental metadata: A table where each row represents a biological sample and each column corresponds to an experimental factor (e.g., treatment, pathology, batch information). The first column must contain the sample identifiers.
- Omic metadata: A separate table must be provided for each omic type. Each row should represent a biomolecule, with relevant information such as gene name, UniProt ID, or biochemical class organized in columns.
- Omic quantification: A separate table must also be provided for each omic type. These tables must follow a "long" format, where rows represent biomolecules and columns represent samples.
The consistency and linkage between these tables rely on matching identifiers. Therefore, it is essential that:
- The sample identifiers in the first column of the experimental metadata table match the column headers (i.e., the first row) of the omic quantification tables.
- The biomolecule identifiers in the first column of both the omic metadata and omic quantification tables match exactly.
TurbOmics also supports an alternative upload method using a single RDS file containing a MultiAssayExperiment object. This object must follow a specific structure:
- The
colDataslot should contain the experimental metadata for biological samples. - The
ExperimentListslot must include a list of omic datasets, each assigned one of the following IDs:Metabolomics,Proteomics, orTranscriptomics. TurbOmics will read only elements with these exact identifiers. - Each dataset in the list must be a
SummarizedExperimentobject, where the quantitative data is stored in theassayslot. Optional metadata for each biomolecule can be included in therowDataslot.
Data Preprocessing
TurbOmics offers a set of functionalities and basic algorithms for preprocessing uploaded quantitative data. Preprocessing is applied independently to each omic layer and involves three consecutive steps: normalization, scaling, and handling missing values.
Normalization
Normalization techniques are used to correct for systemic and technical variations that can obscure biological signals and lead to misleading conclusions. TurbOmics provides two widely used and flexible normalization methods:
- Variance Stabilization Normalization (VSN): Quantitative data undergo an affine transformation to bring measurements from different samples to a common scale (VSN documentation). A variance-stabilizing transformation is then applied to make the variance independent of the mean.
- Log2-median normalization: Quantitative data are transformed using a binary logarithm (log₂), followed by median centering within each sample.
Scaling
Different omics datasets often exhibit varying value ranges due to differences in technological platforms and the normalization methods applied during data generation. These disparities can compromise multi-omics integration, leading to distorted visualizations or reduced interpretability in quantitative data representations (e.g., heatmaps). To address this, TurbOmics provides an option to standardize omics data by setting the mean of each biomolecule to 0 and the standard deviation to 1.
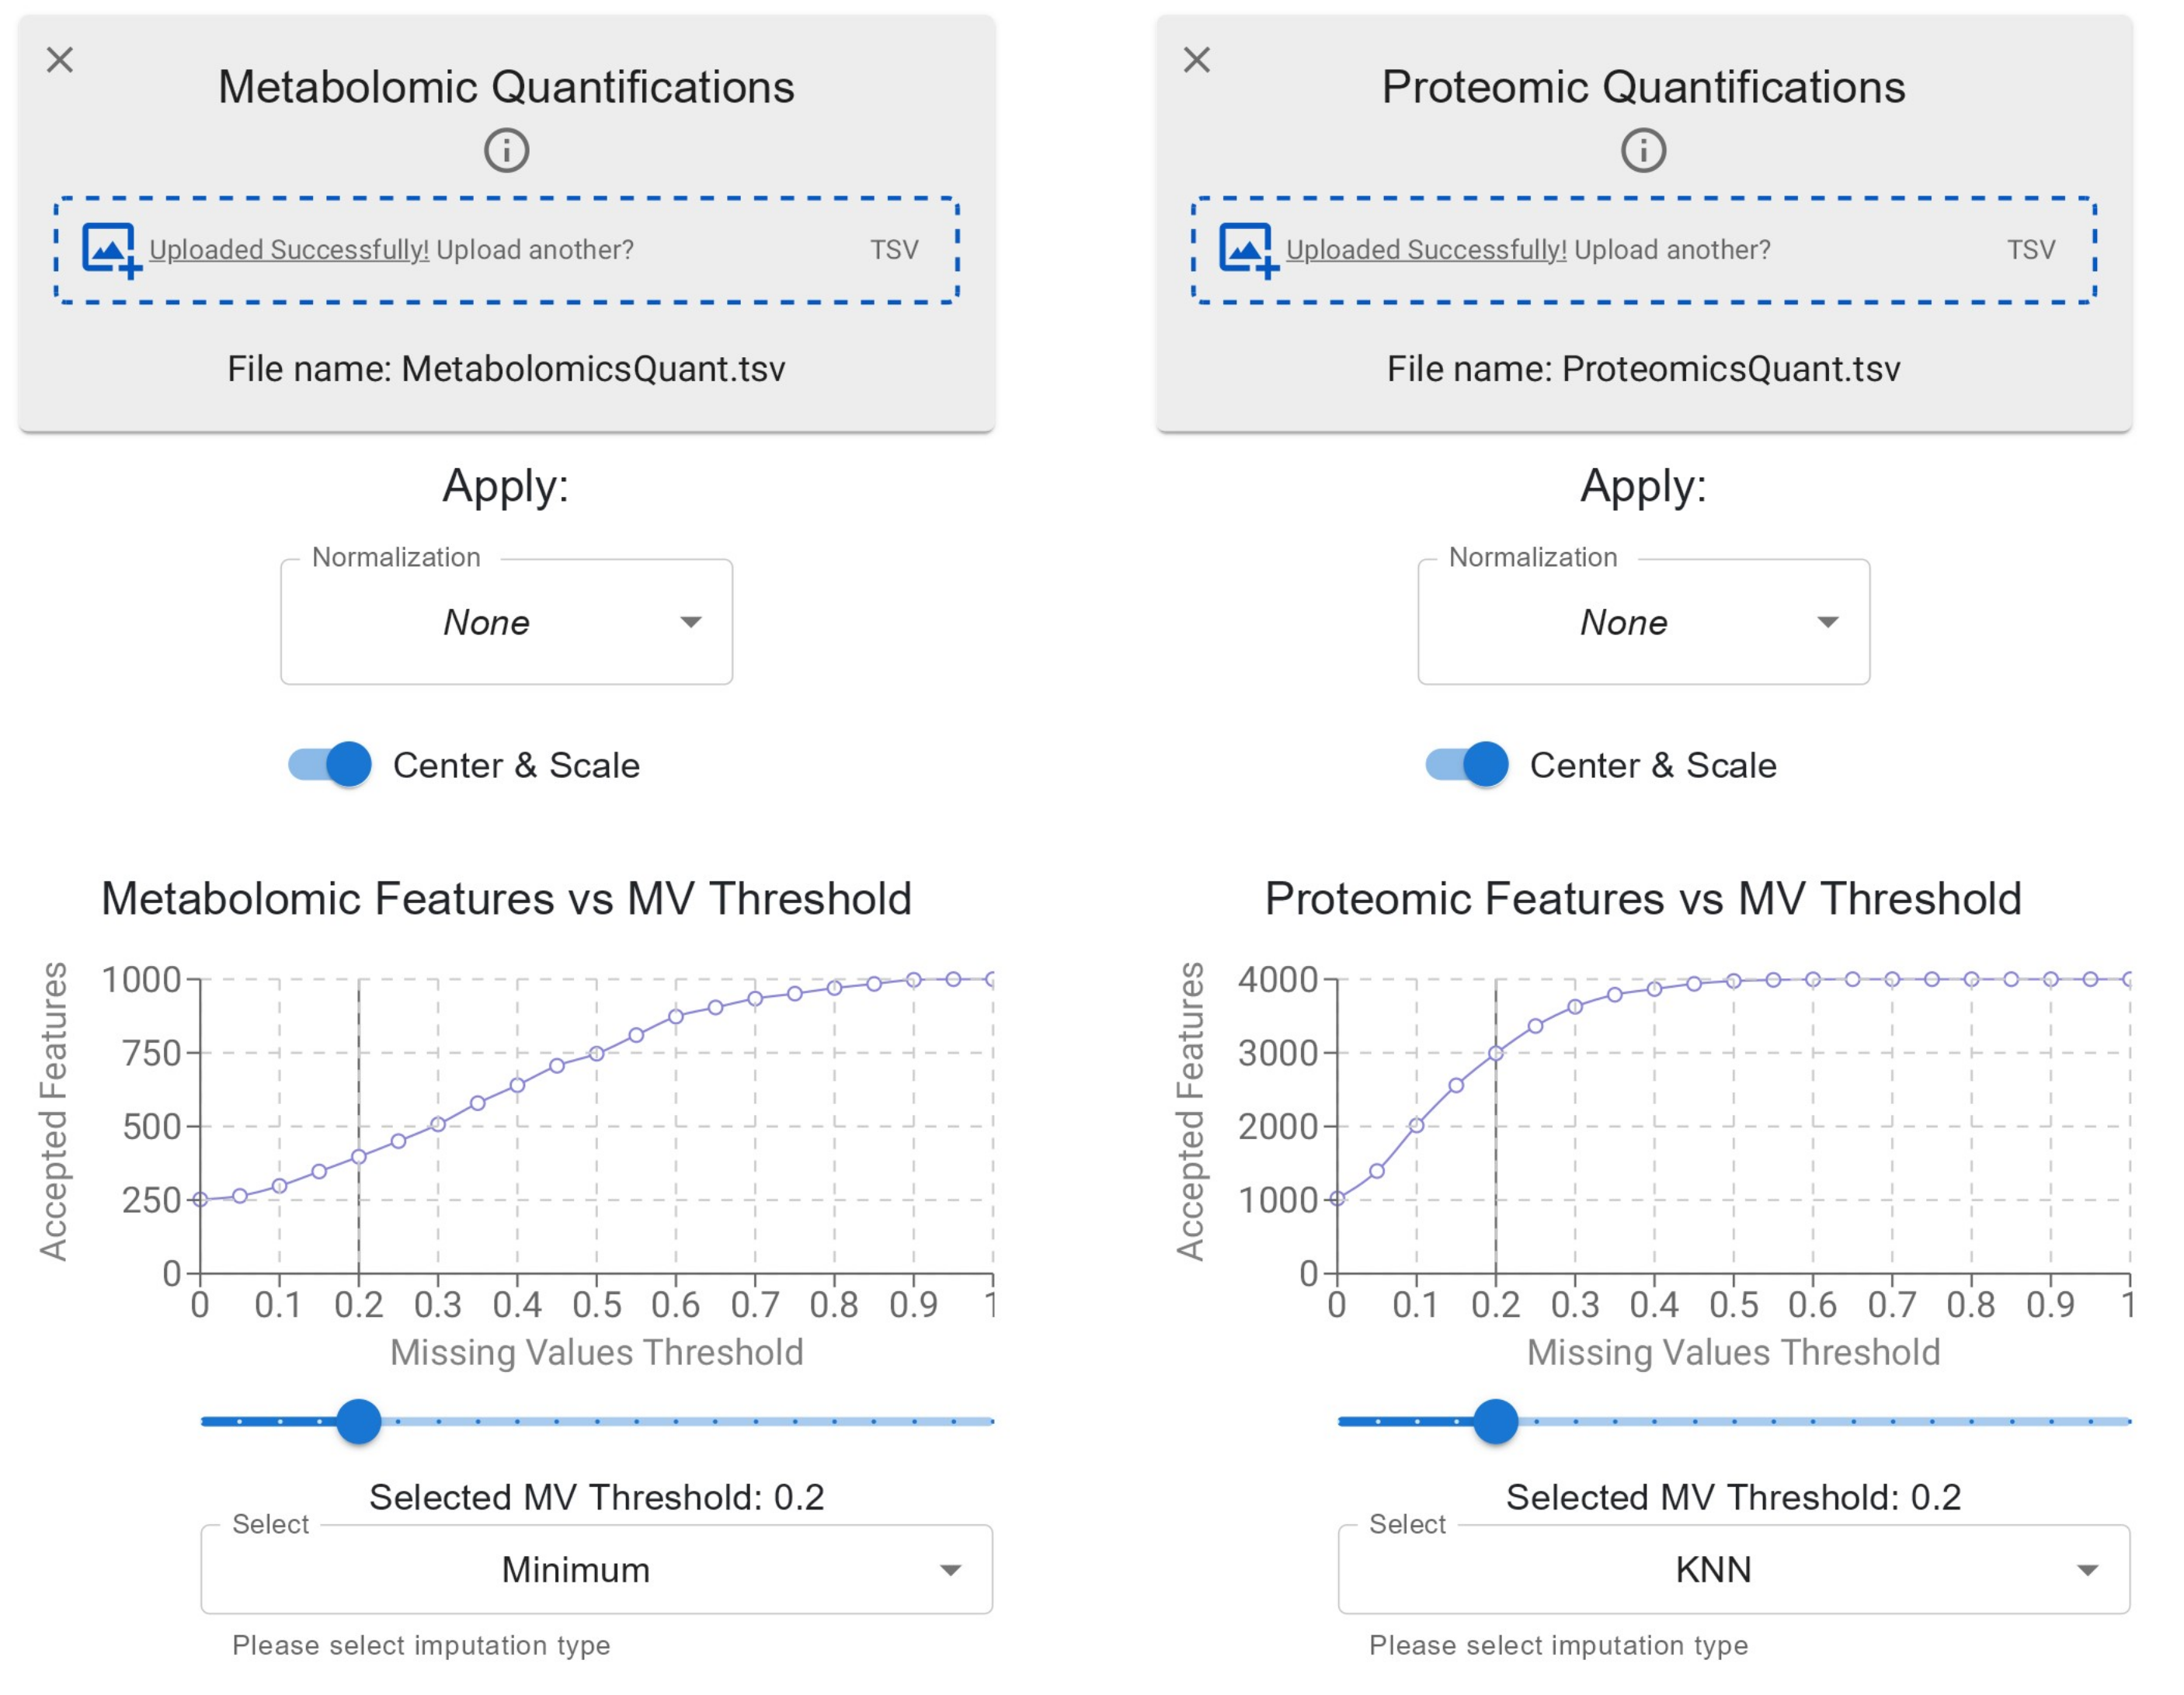
Missing Values
TurbOmics combines two strategies to balance information retention and missing value imputation. After uploading omic quantitative data, the platform displays a line plot showing the number of retained biomolecules as a function of the selected missing value fraction threshold. Users can interactively adjust this threshold and observe in real time how many biomolecules are retained.
After filtering, users can choose from several imputation techniques to handle missing values in the remaining biomolecules:
- KNN imputation: Missing values are estimated using the average of the k-nearest neighbors, determined based on Euclidean distance.
- Mean/Median imputation: Missing values are replaced with the mean or median value of the corresponding biomolecule across all samples.
- Minimum value imputation: Missing values are replaced with the global minimum value of the entire dataset.
Importantly, TurbOmics handles missing values independently for each omic type. This design allows users to apply different filtering and imputation methods tailored to the technical and methodological characteristics of each omic dataset, increasing the flexibility and robustness of the workflow.
Putative Annotations
TurbOmics provides two alternative approaches for handling putative metabolite annotations:
- User-provided annotations: Users can upload a metabolomics metadata table that includes identifications or putative annotations previously obtained using tools such as MetaboSearch or CMM, simplified with TurboPutative.
- Automated annotation generation: TurbOmics can automatically generate putative annotations for all detected features in a metabolomics experiment by executing CMM and TurboPutative.
The resulting annotations are integrated into the metabolomics metadata table and made available in sections dedicated to multi-omics integration.
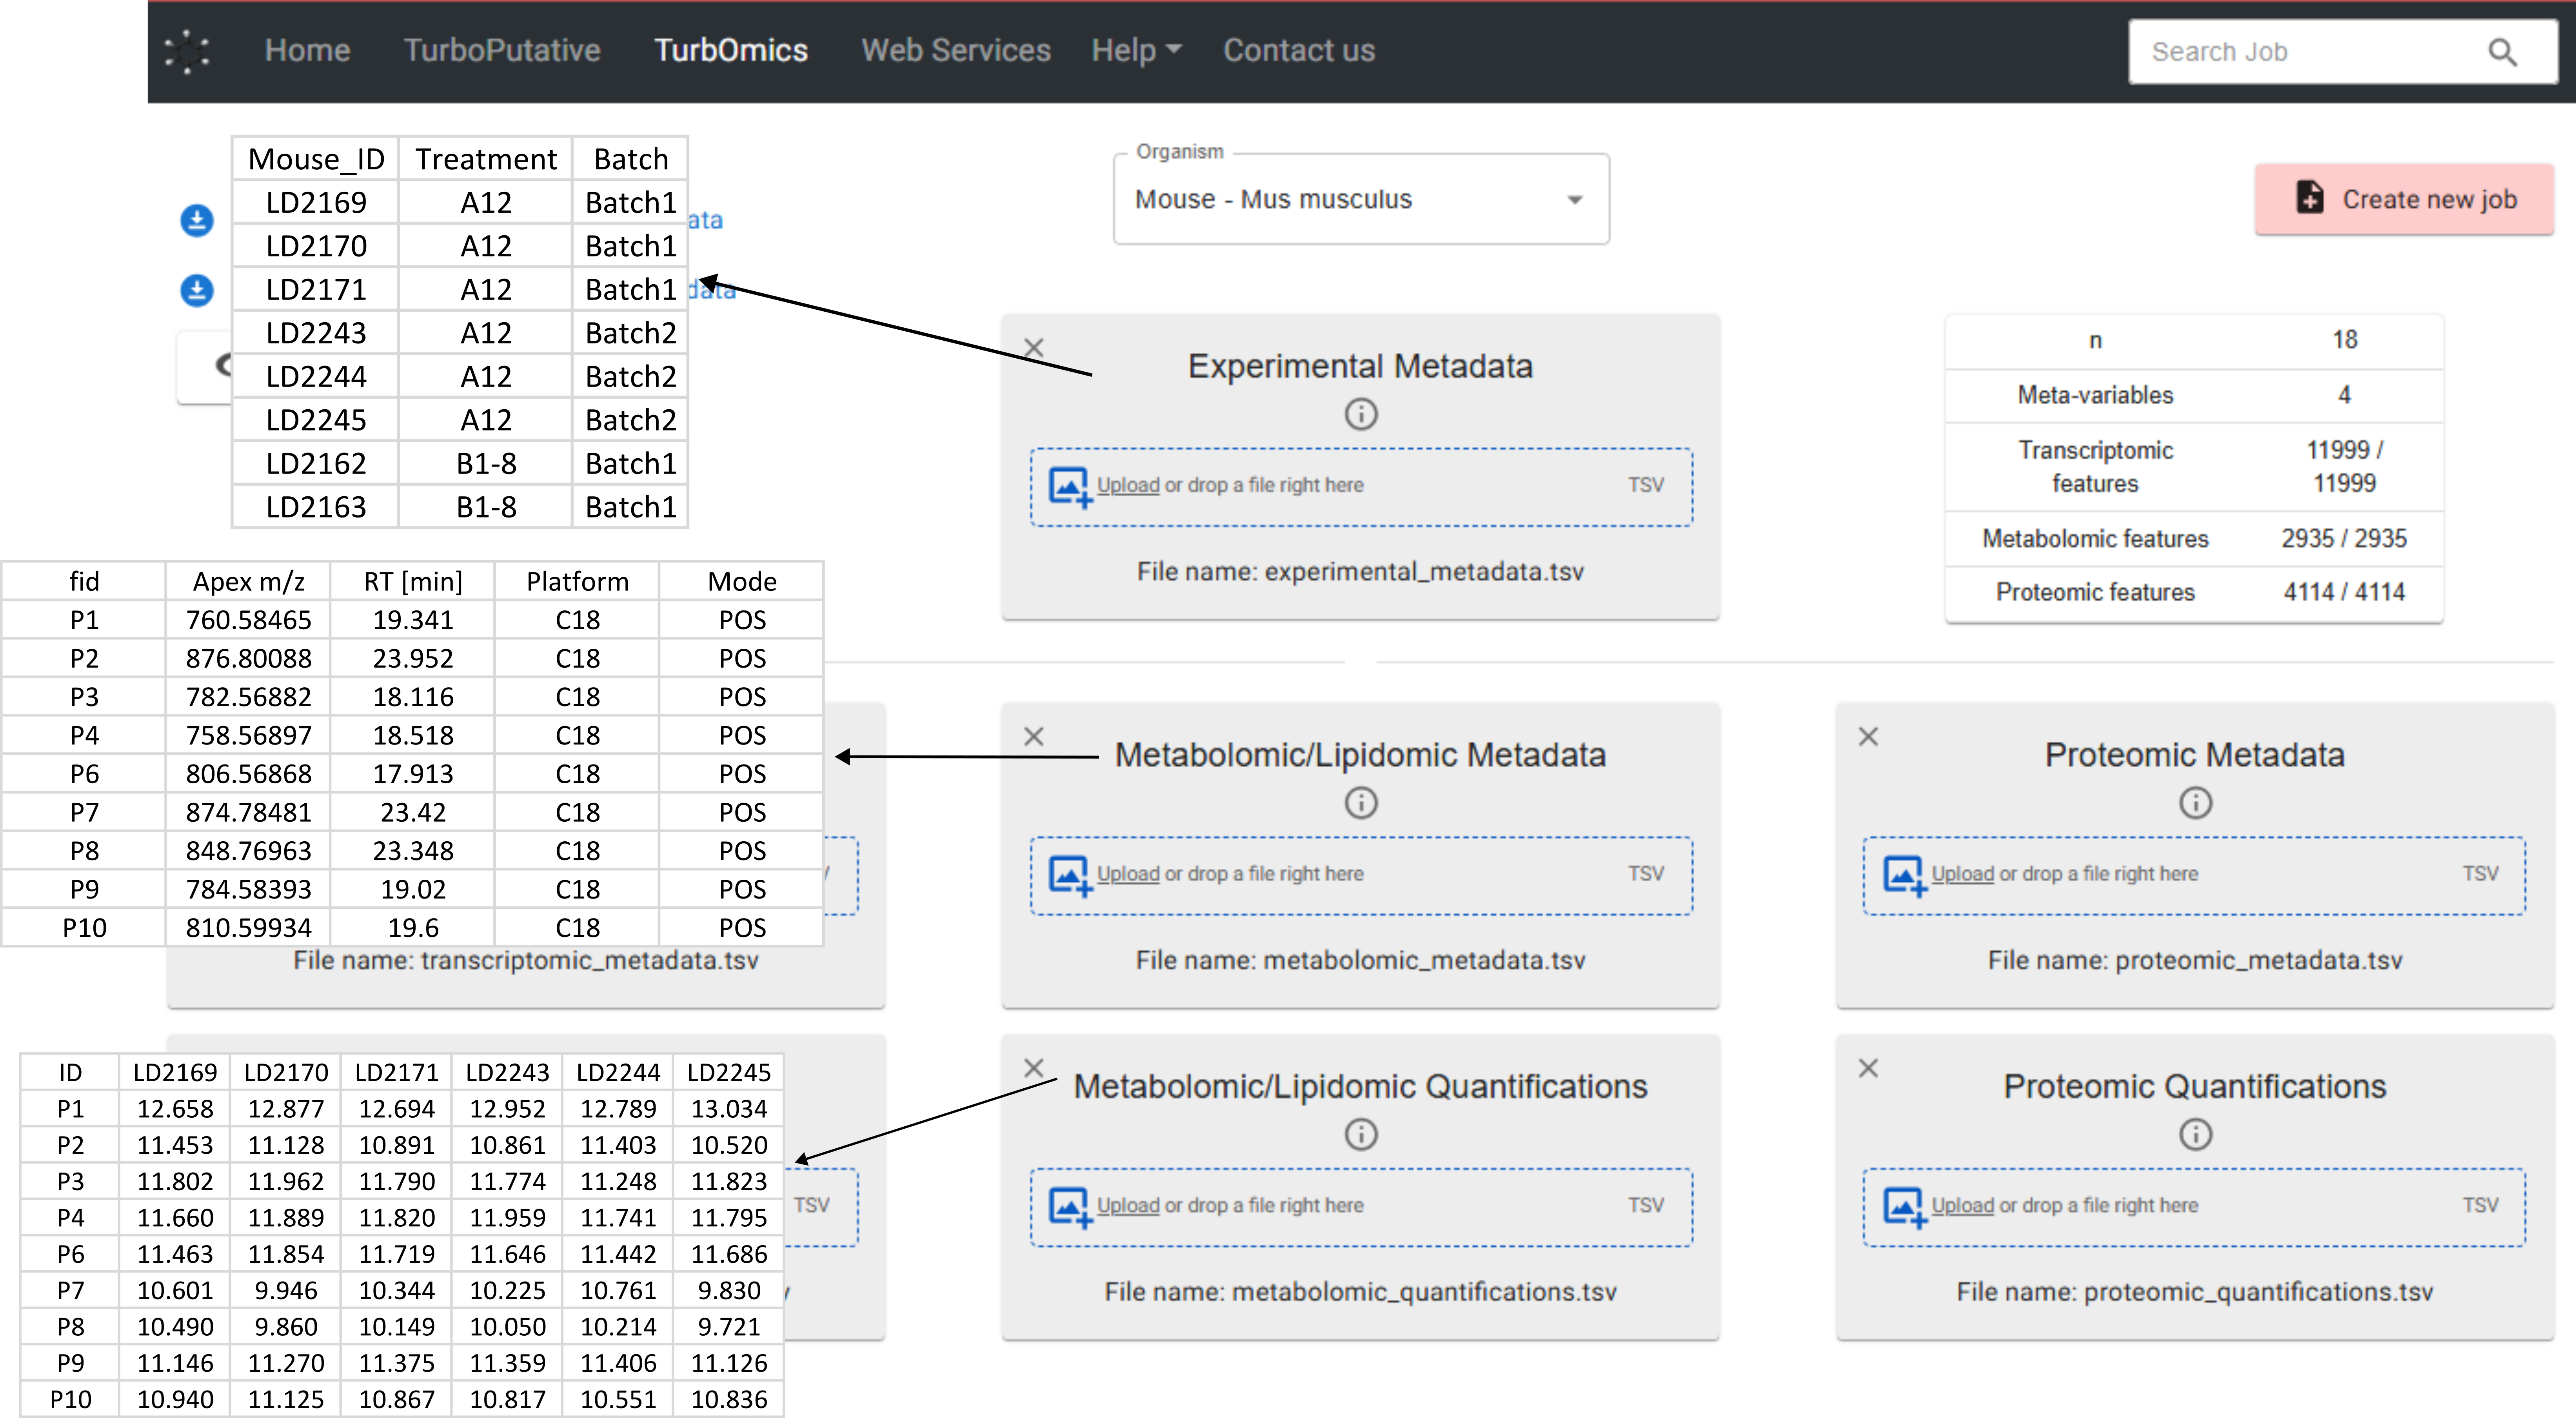
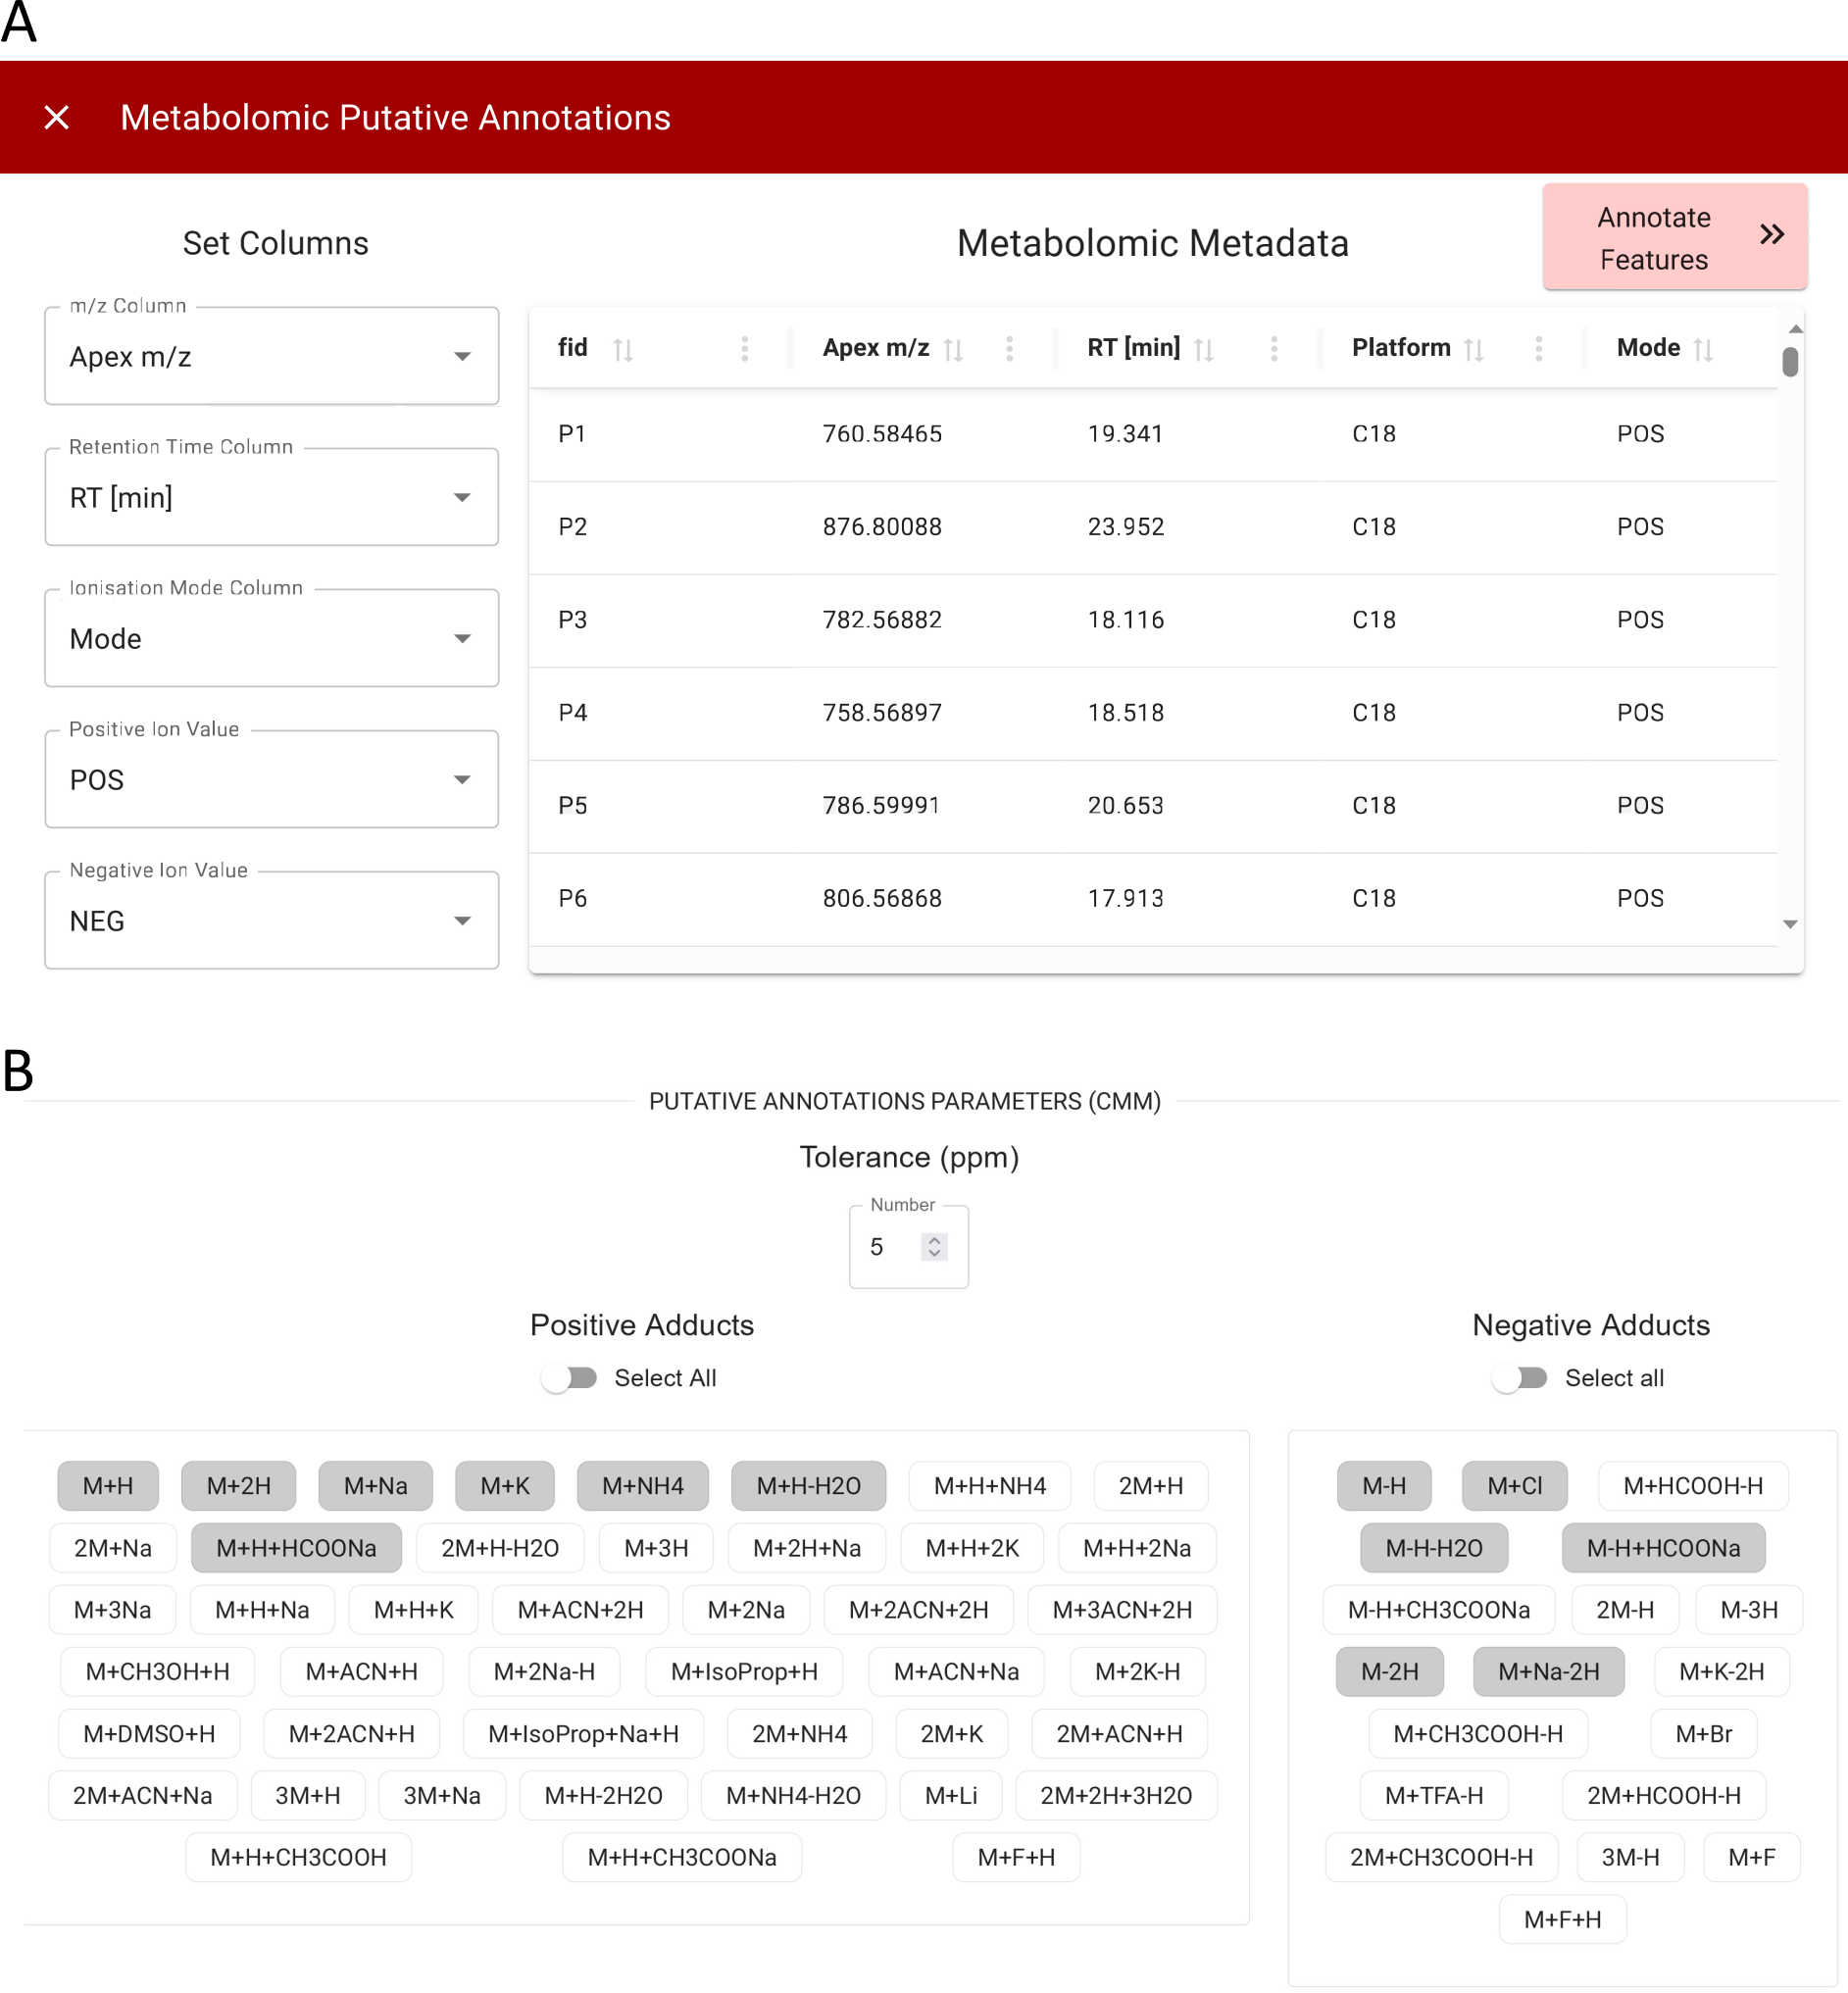
To enable automated annotation, users must upload a metabolomics metadata table containing the m/z, retention time (RT), and ionization mode (positive or negative) for each feature (Figure 6A). The m/z value and ionization mode are essential for annotation via CMM, while the RT is used by the TPMetrics module to prioritize annotations based on correlation analyses between features. Users can further customize the annotation process by specifying parameters such as parts-per-million (ppm) tolerances for m/z-based searches and selecting potential adducts for both positive and negative ionization modes (Figure 6B).
CMM compares the m/z values of detected features against in-house libraries and external databases such as HMDB, LipidMaps, METLIN, and KEGG. The resulting candidate annotations are then processed by the four modules of TurboPutative: Tagger, REname, RowMerger, and TPMetrics. The final output, TPFilter, provides the most likely annotation for each feature and is integrated with the user-supplied metabolomics metadata table.
Exploratory Data Analysis
The Exploratory Data Analysis module provides researchers with an initial overview and visualization of the data uploaded to the platform. In TurbOmics, exploratory analysis is conducted independently for each omics dataset. To support this process, the platform includes two dedicated modules: Data Distribution and Principal Component Analysis (PCA).
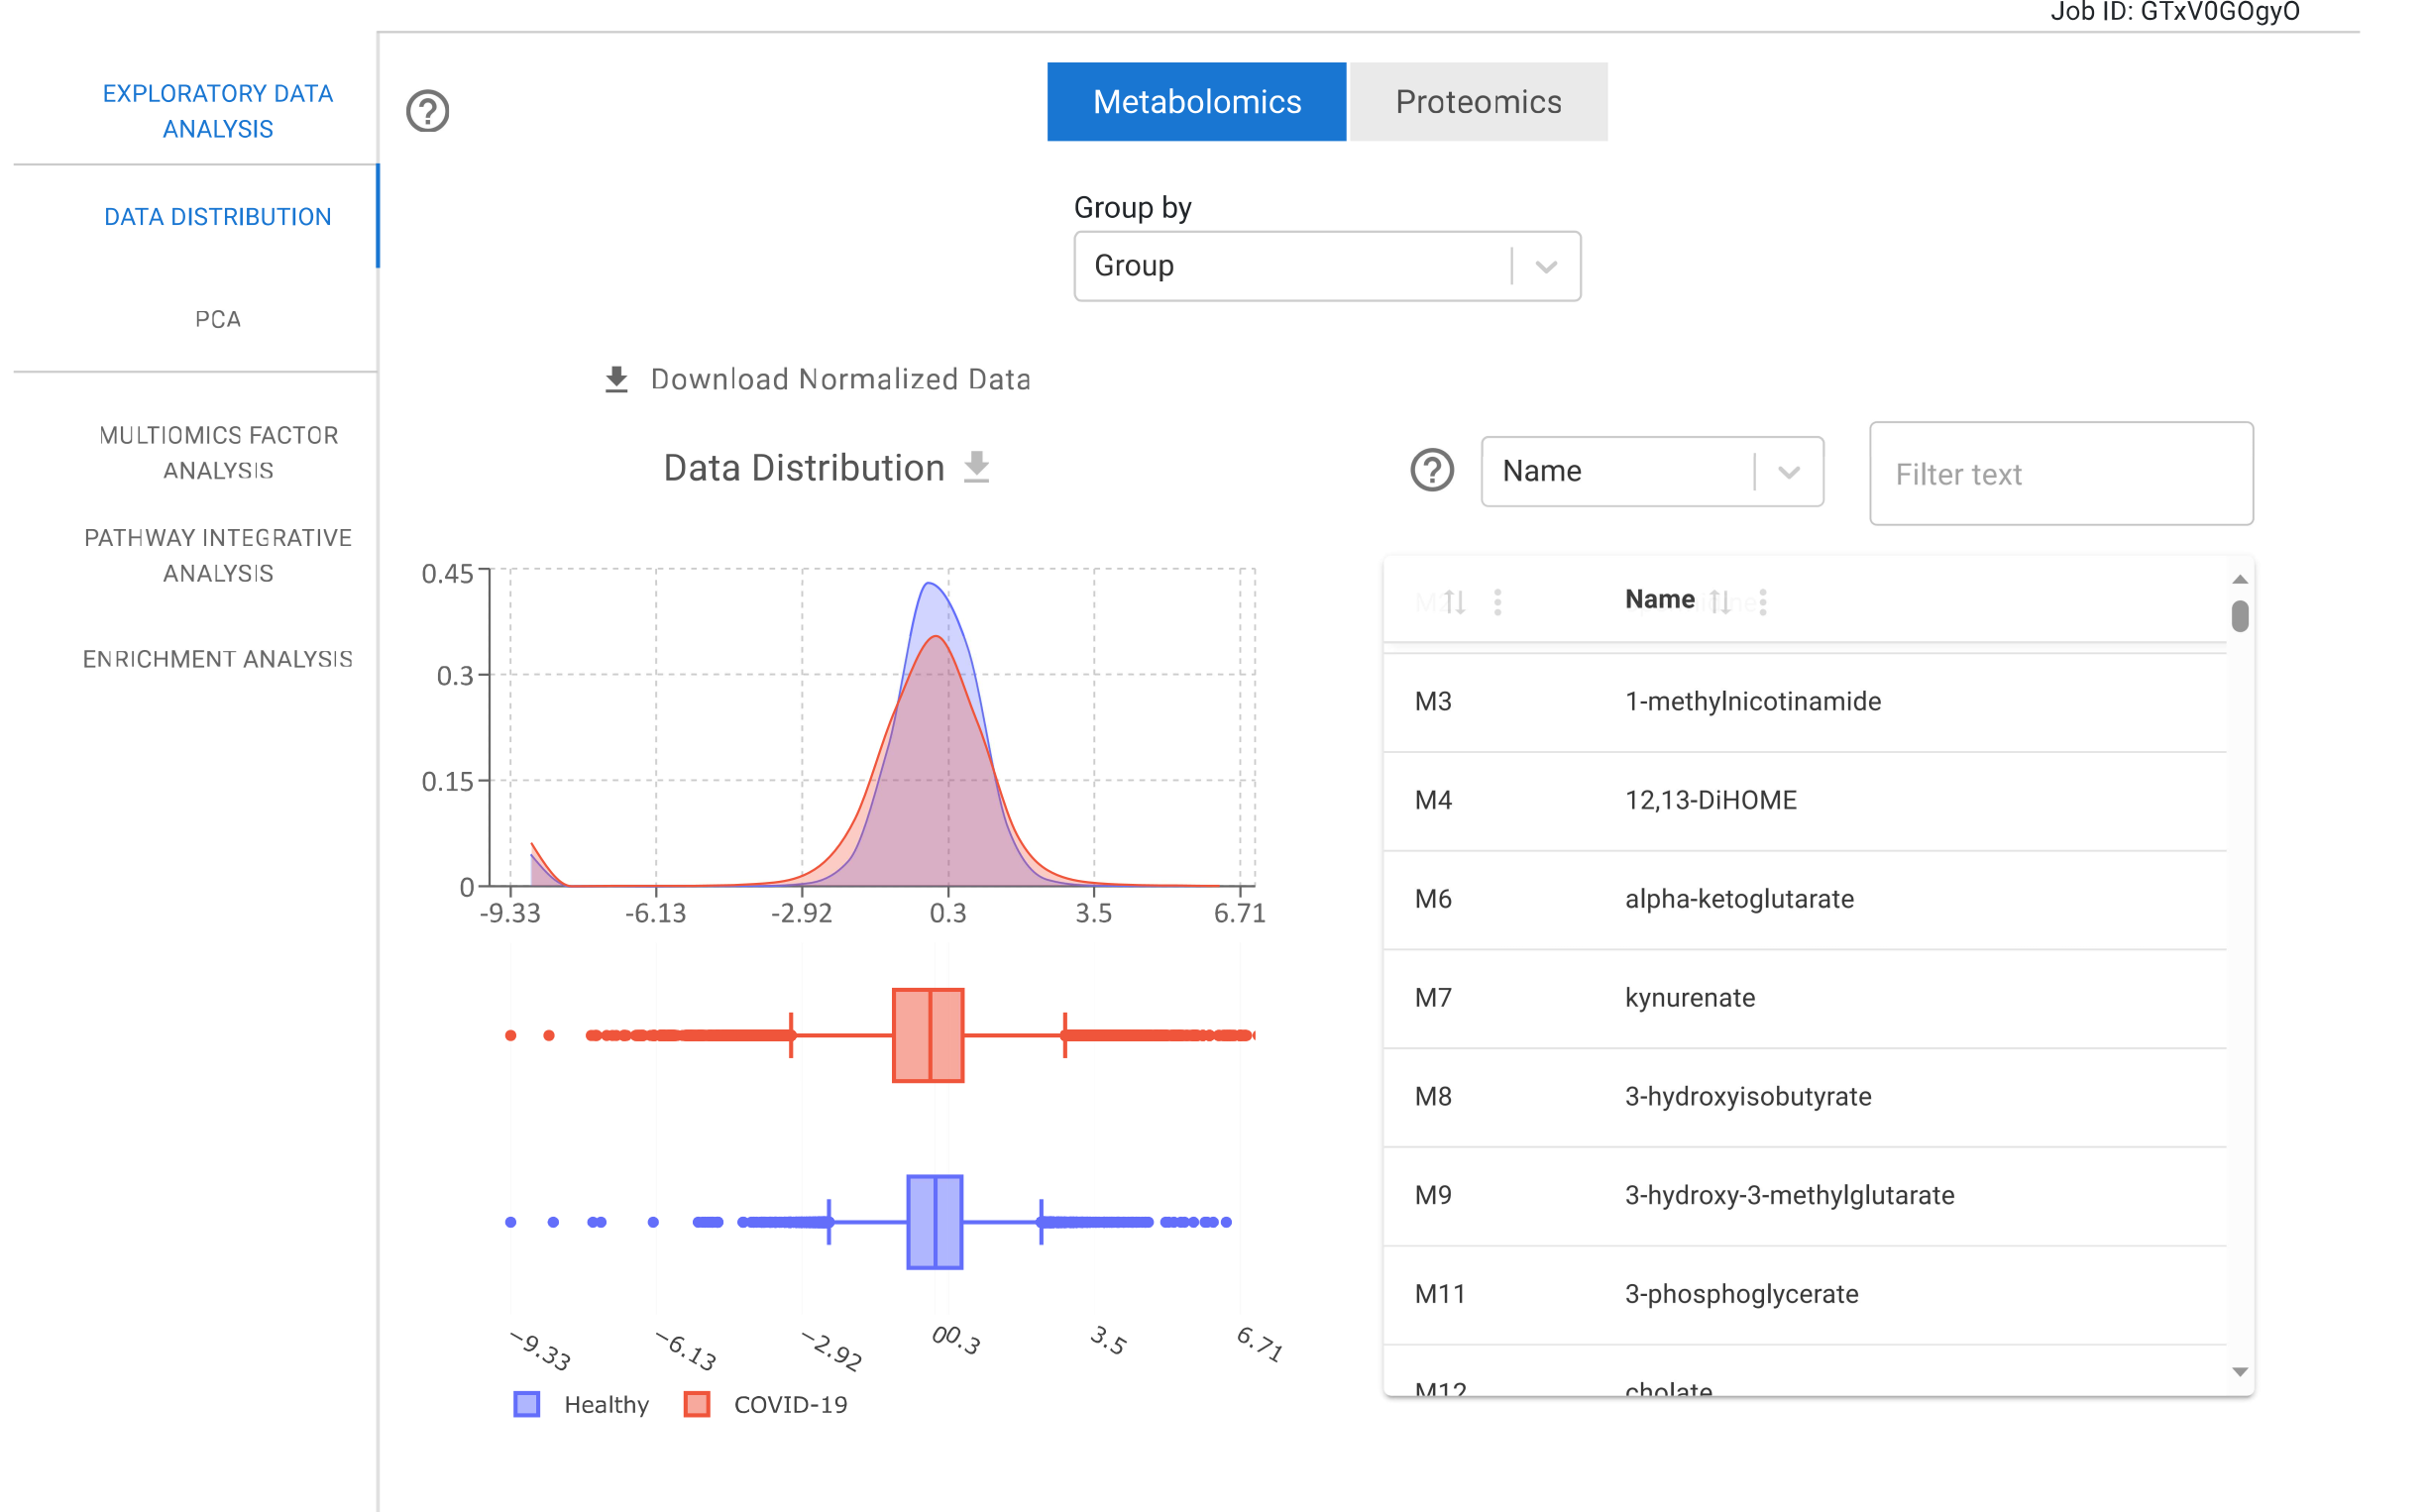
Data Distribution
This module allows users to examine the distribution of quantitative data using density plots and box plots. Users can explore these distributions by grouping samples according to metadata categories. The platform also enables visualization of specific sets of biomolecules filtered by the user.
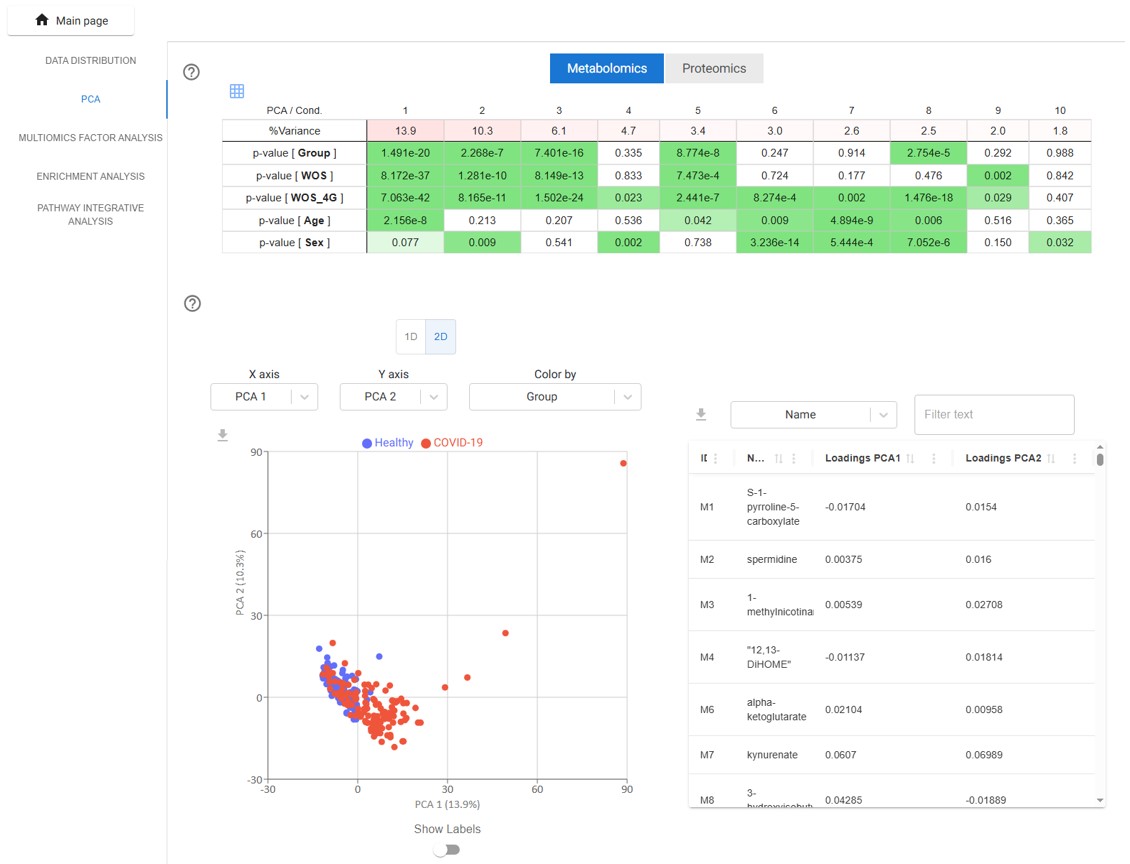
PCA
TurbOmics computes the first ten principal components and calculates correlations between the component scores and metadata variables. The percentage of variance explained by each component, along with the p-values from the correlations, is shown in a color-coded table— allowing users to quickly identify associations between quantitative data and metadata.
Users can also select specific principal components to visualize sample scores in one- or two-dimensional scatter plots. Additionally, an interactive table of PCA loadings is provided, highlighting the contribution of each biomolecule to each principal component.
Multi-Omics Factor Analysis
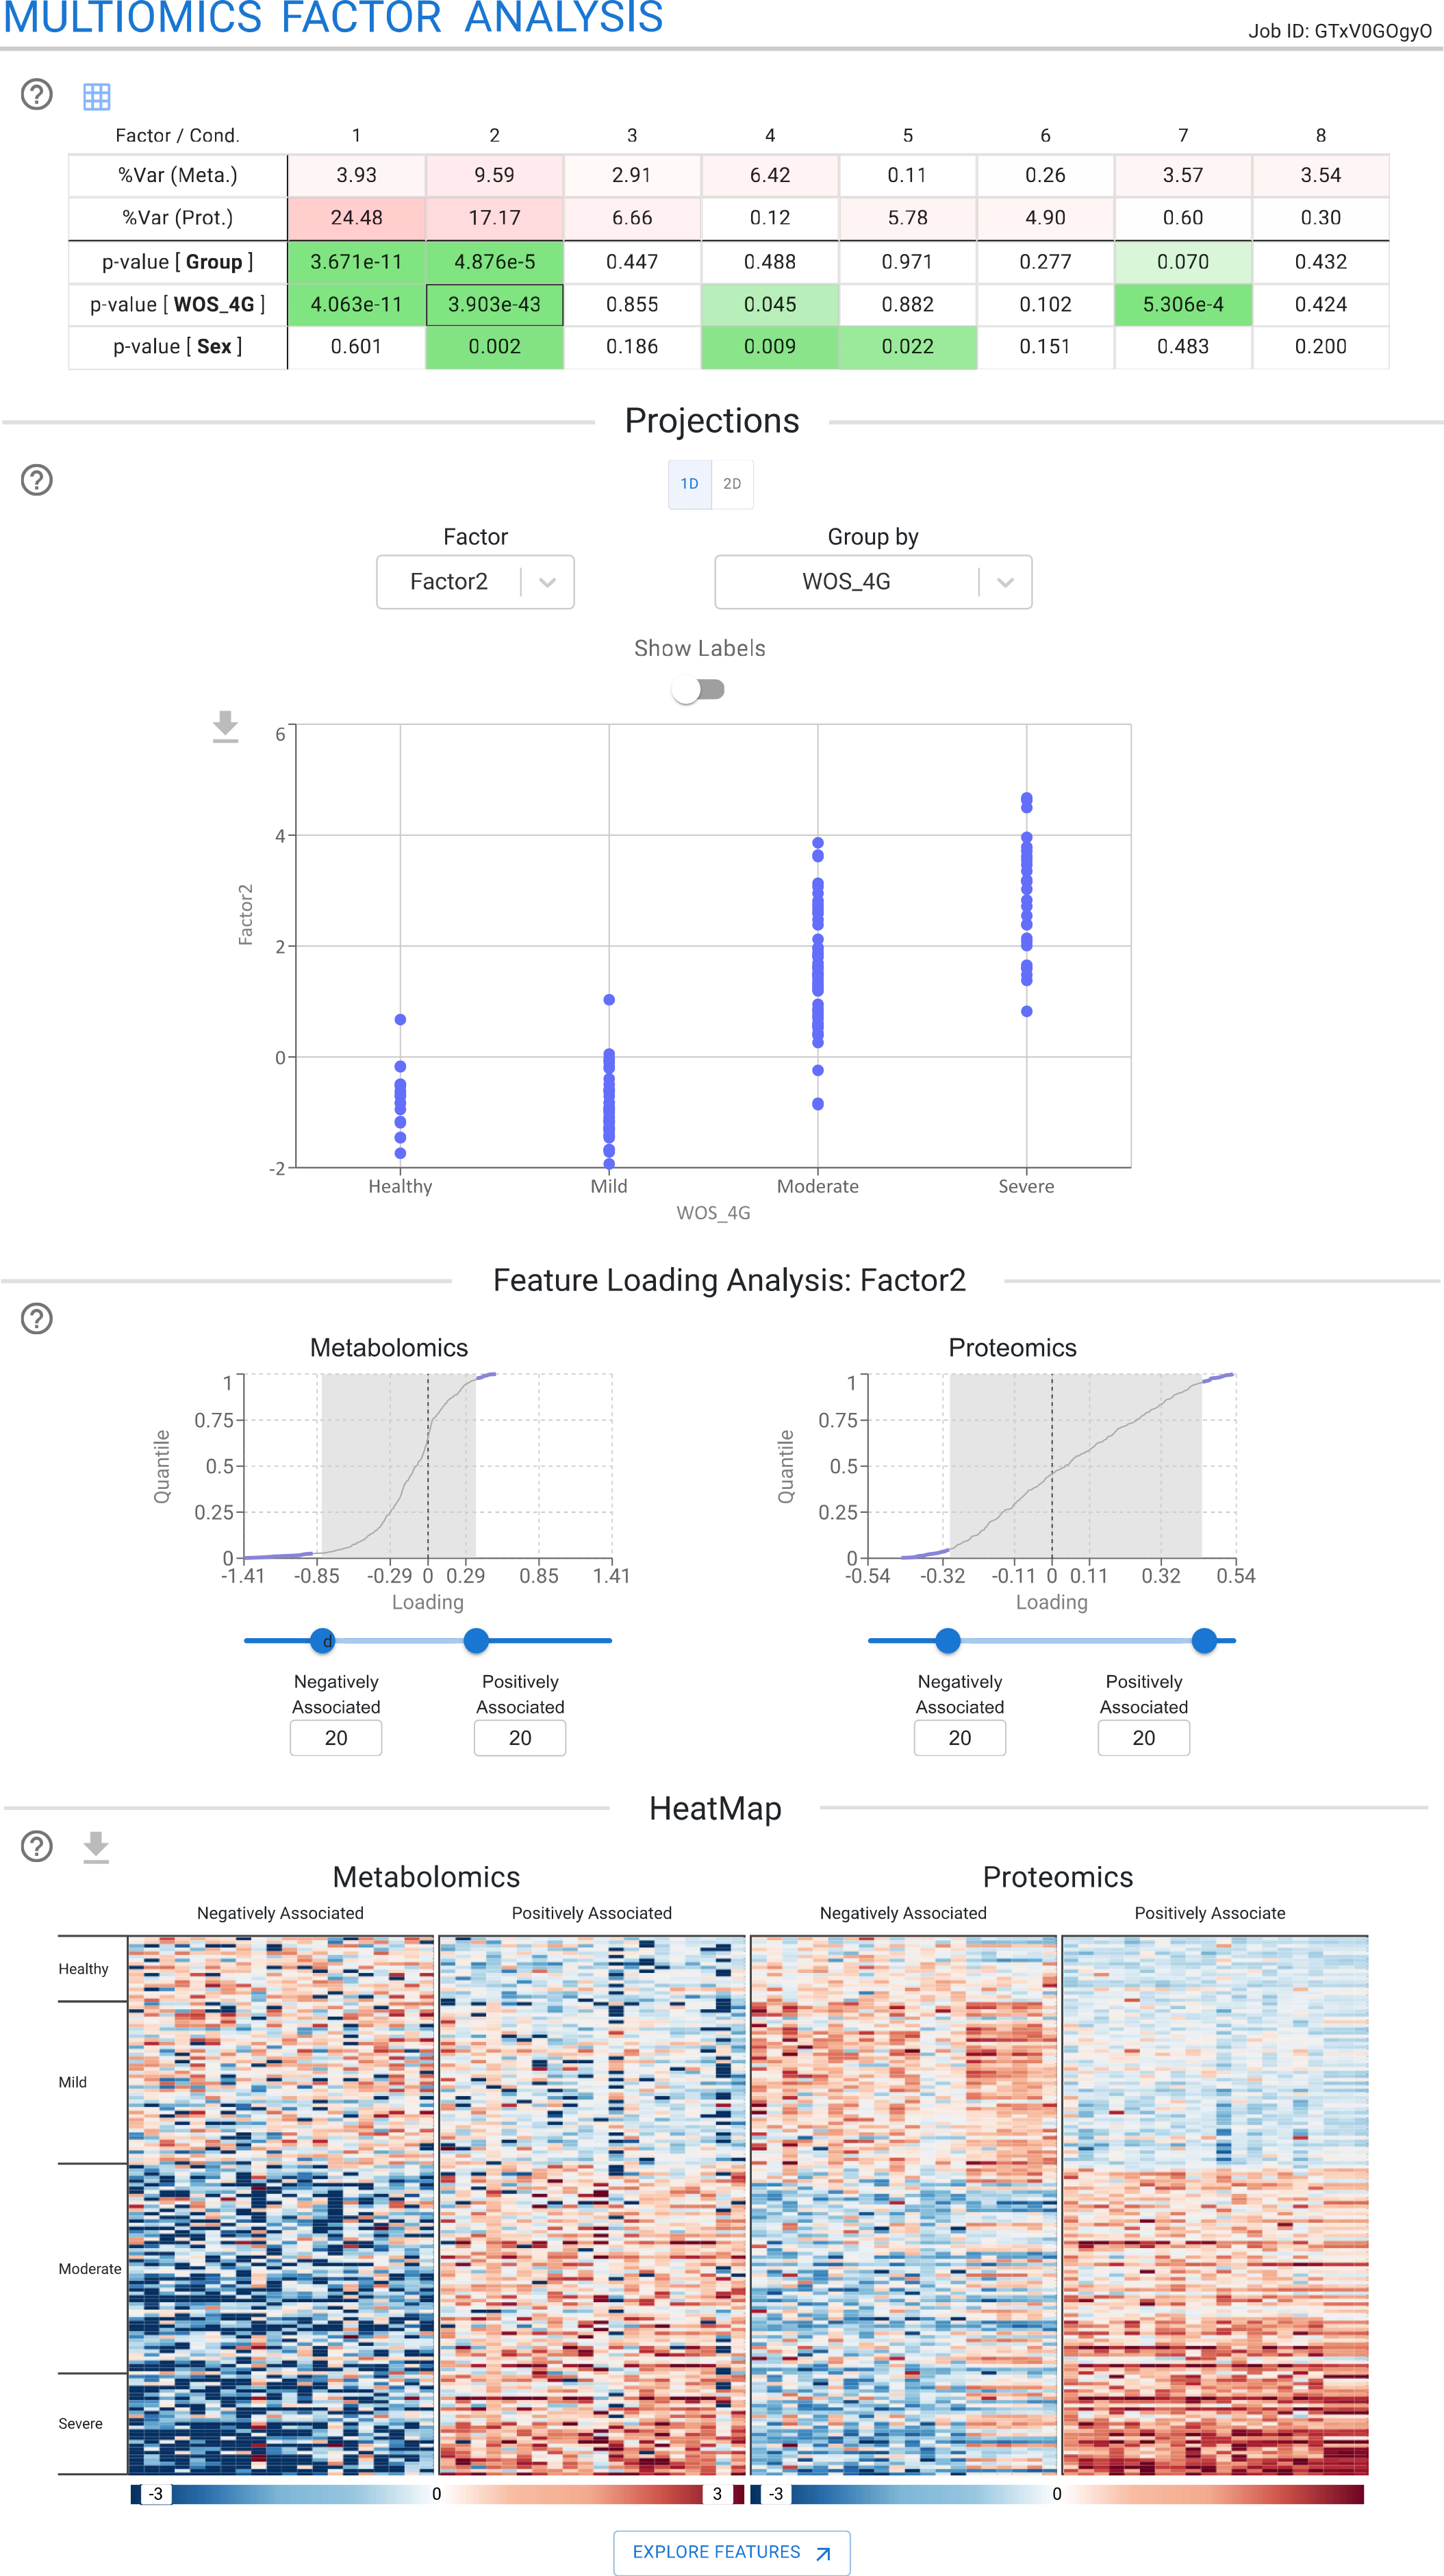
The Multi-Omics Factor Analysis module enables the unbiased and integrative decomposition of multi-omics quantitative data into latent factors. This module is based on the MOFA framework, which identifies latent factors that capture the main sources of variation across the analyzed datasets. TurbOmics supports the visualization of sample subgroups and shared patterns across different omics layers.
First, users can explore a color-coded table summarizing the factors computed by MOFA. This table displays the percentage of variance explained by each factor in each omics dataset, along with p-values from correlations between factor scores and metadata variables. This facilitates the rapid identification of factors associated with biological conditions of interest.
Users can further investigate specific biological conditions and factors of interest directly within the TurbOmics platform. They can examine the distribution of factor loadings for each omics dataset and select the top-n biomolecules with the highest positive or negative loadings for visualization in a heatmap. Notably, TurbOmics also enables users to identify the biomolecules most strongly associated with each factor and to perform Over-Representation Analysis (ORA) on each omics dataset using GO, KEGG, and Reactome annotations.
Pathway Integrative Analysis
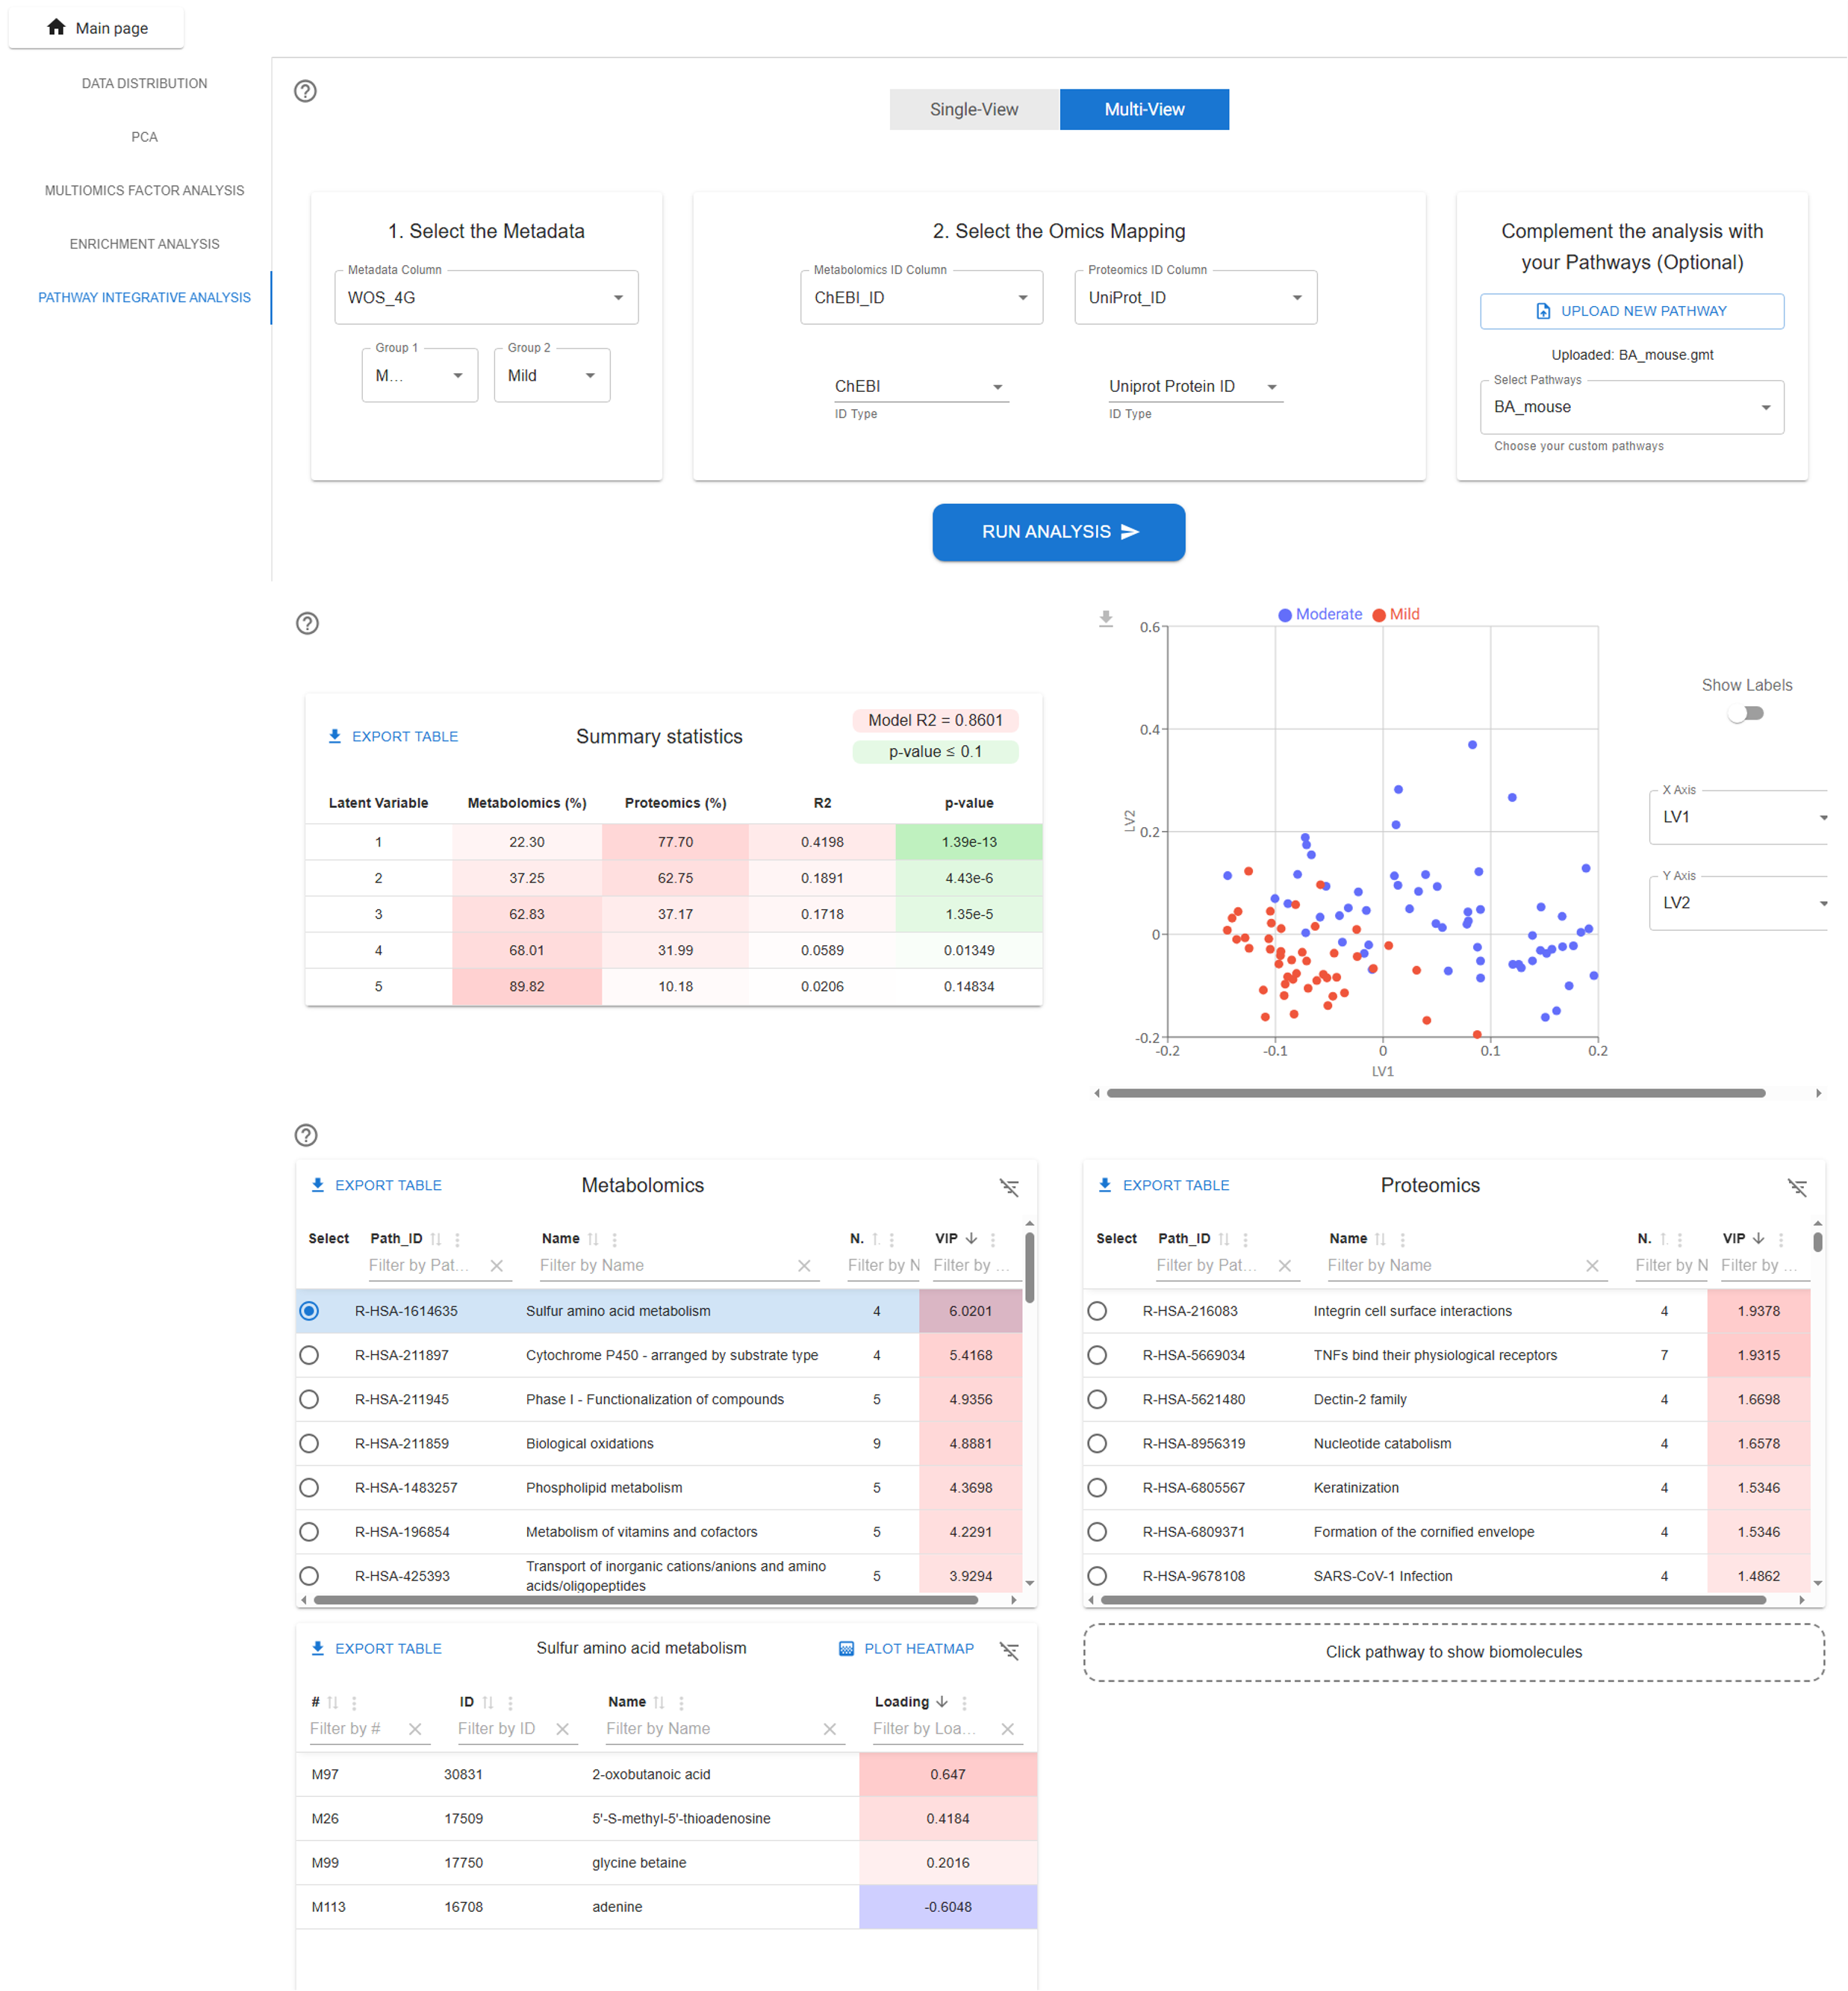
The Pathway Integrative Analysis module in TurbOmics performs pathway-based multi-omics integration, enhancing interpretability and improving the detection of biologically meaningful pathway signals with greater power and sensitivity. This module leverages the PathIntegrate modeling framework, specifically designed for multi-omics integration at the pathway level. PathIntegrate condenses molecular-level measurements into pathway scores for each individual sample.
Pathway-based multi-omics integration is performed using both the Multi-View and Single-View PathIntegrate frameworks. Briefly, the Multi-View approach calculates pathway scores independently for each omics layer, providing interpretable insights within and across omics. In contrast, the Single-View approach computes more comprehensive pathway scores by integrating quantitative information from multiple omics layers.
Within TurbOmics, users can select either the Single-View or Multi-View supervised models, specify comparison groups, and define the columns containing biomolecule identifiers. Upon execution, the platform displays a summary table with key statistical details of the model, along with a scatter plot showing sample projections onto the latent variables. Additionally, a table highlights the most relevant pathways and their associated biomolecules.
The users can add their own biological pathways in GMT format, making it possible to incorporate personal or specialized biological knowledge into TurbOmics workflows. The GMT (Gene Matrix Transposed) format is a simple text format in which each line represents a pathway, starting with the pathway name and description, followed by a list of associated molecules, such as metabolites or genes. Once uploaded, these custom pathways are stored on the server and become available for selection through an intuitive interface. Users can then choose one or more of their pathways and include them in downstream analyses.
These pathways can be used in the Pathway Integrative Analysis (Pathway Integrate method), which combines multiple layers of omics data (such as metabolomics, transcriptomics, or proteomics) to assess pathway-level activity in a unified way, providing a more comprehensive view of system-wide biological regulation.
In addition, the pathways can be used in the in the Metabolite Set Enrichment Analysis (MSEA), where the software evaluates whether groups of related metabolites are statistically overrepresented at the top or bottom of a ranked list. This helps identify biological processes that are significantly associated with the experimental condition under study.
Enrichment Analysis
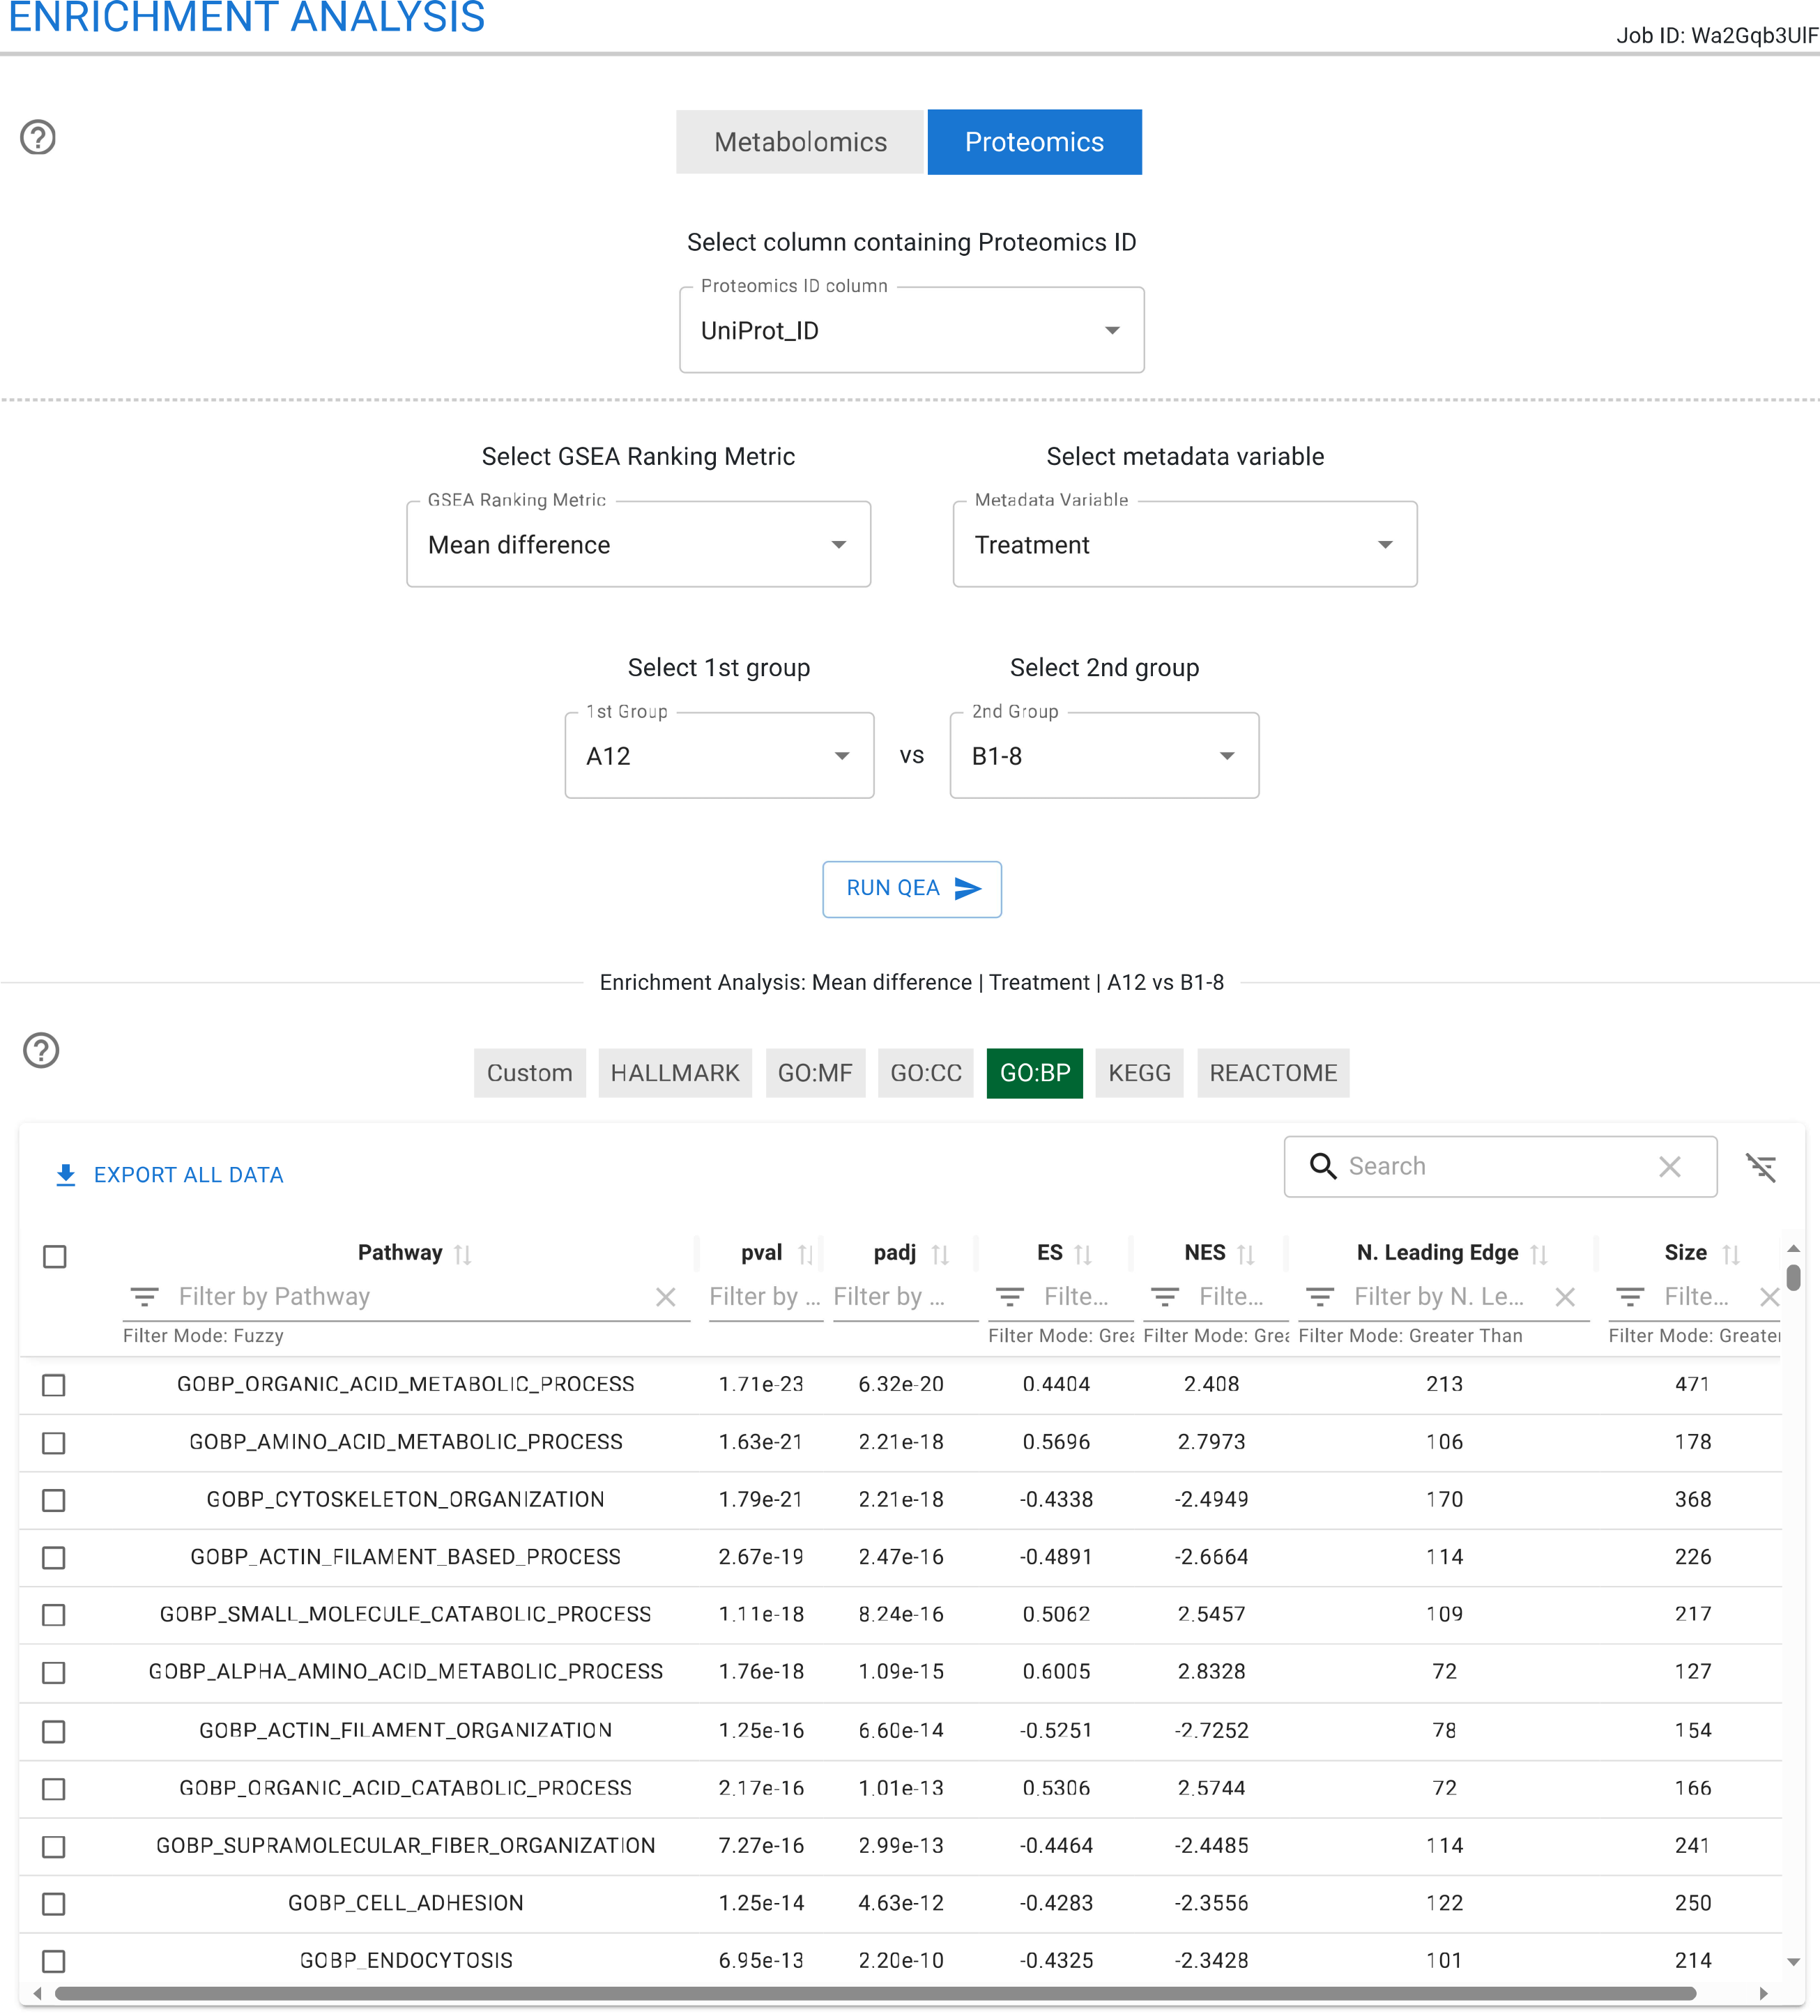
The Enrichment Analysis module enables the identification of enriched functional categories for each omics dataset in parallel. This section allows users to run the GSEA algorithm simultaneously across transcriptomics, proteomics, and metabolomics data, facilitating the comparison of statistically significant pathways between these datasets.
Users must specify the biomolecule identifier column and select a metric for GSEA, such as LogFC or t-statistic. Additionally, PCA and MOFA loadings can be used as input metrics, enabling deeper analysis of the components and factors computed in earlier modules.
For untargeted metabolomics data, enrichment analysis can be performed using the mummichog library. The results are presented in an interactive and exportable table that includes the biomolecules responsible for the enrichment of each category.
TurbOmics also supports custom enrichment analysis, allowing users to define and explore their own functional categories.
Sample Data Tutorial
We have included a comprehensive step-by-step tutorial that walks through the case studies showcased in detail in the manuscript and reproduced using the provided sample data. This PDF tutorial guides you through each stage of the analysis described in the TurbOmics study, mirroring the experiments presented in the scientific paper and helping you replicate the workflow within your own environment.
You can download the full tutorial here: TurbOmics_StepByStep_Tutorial.pdf